7 Application Performance Issues That Can Drive Users Away
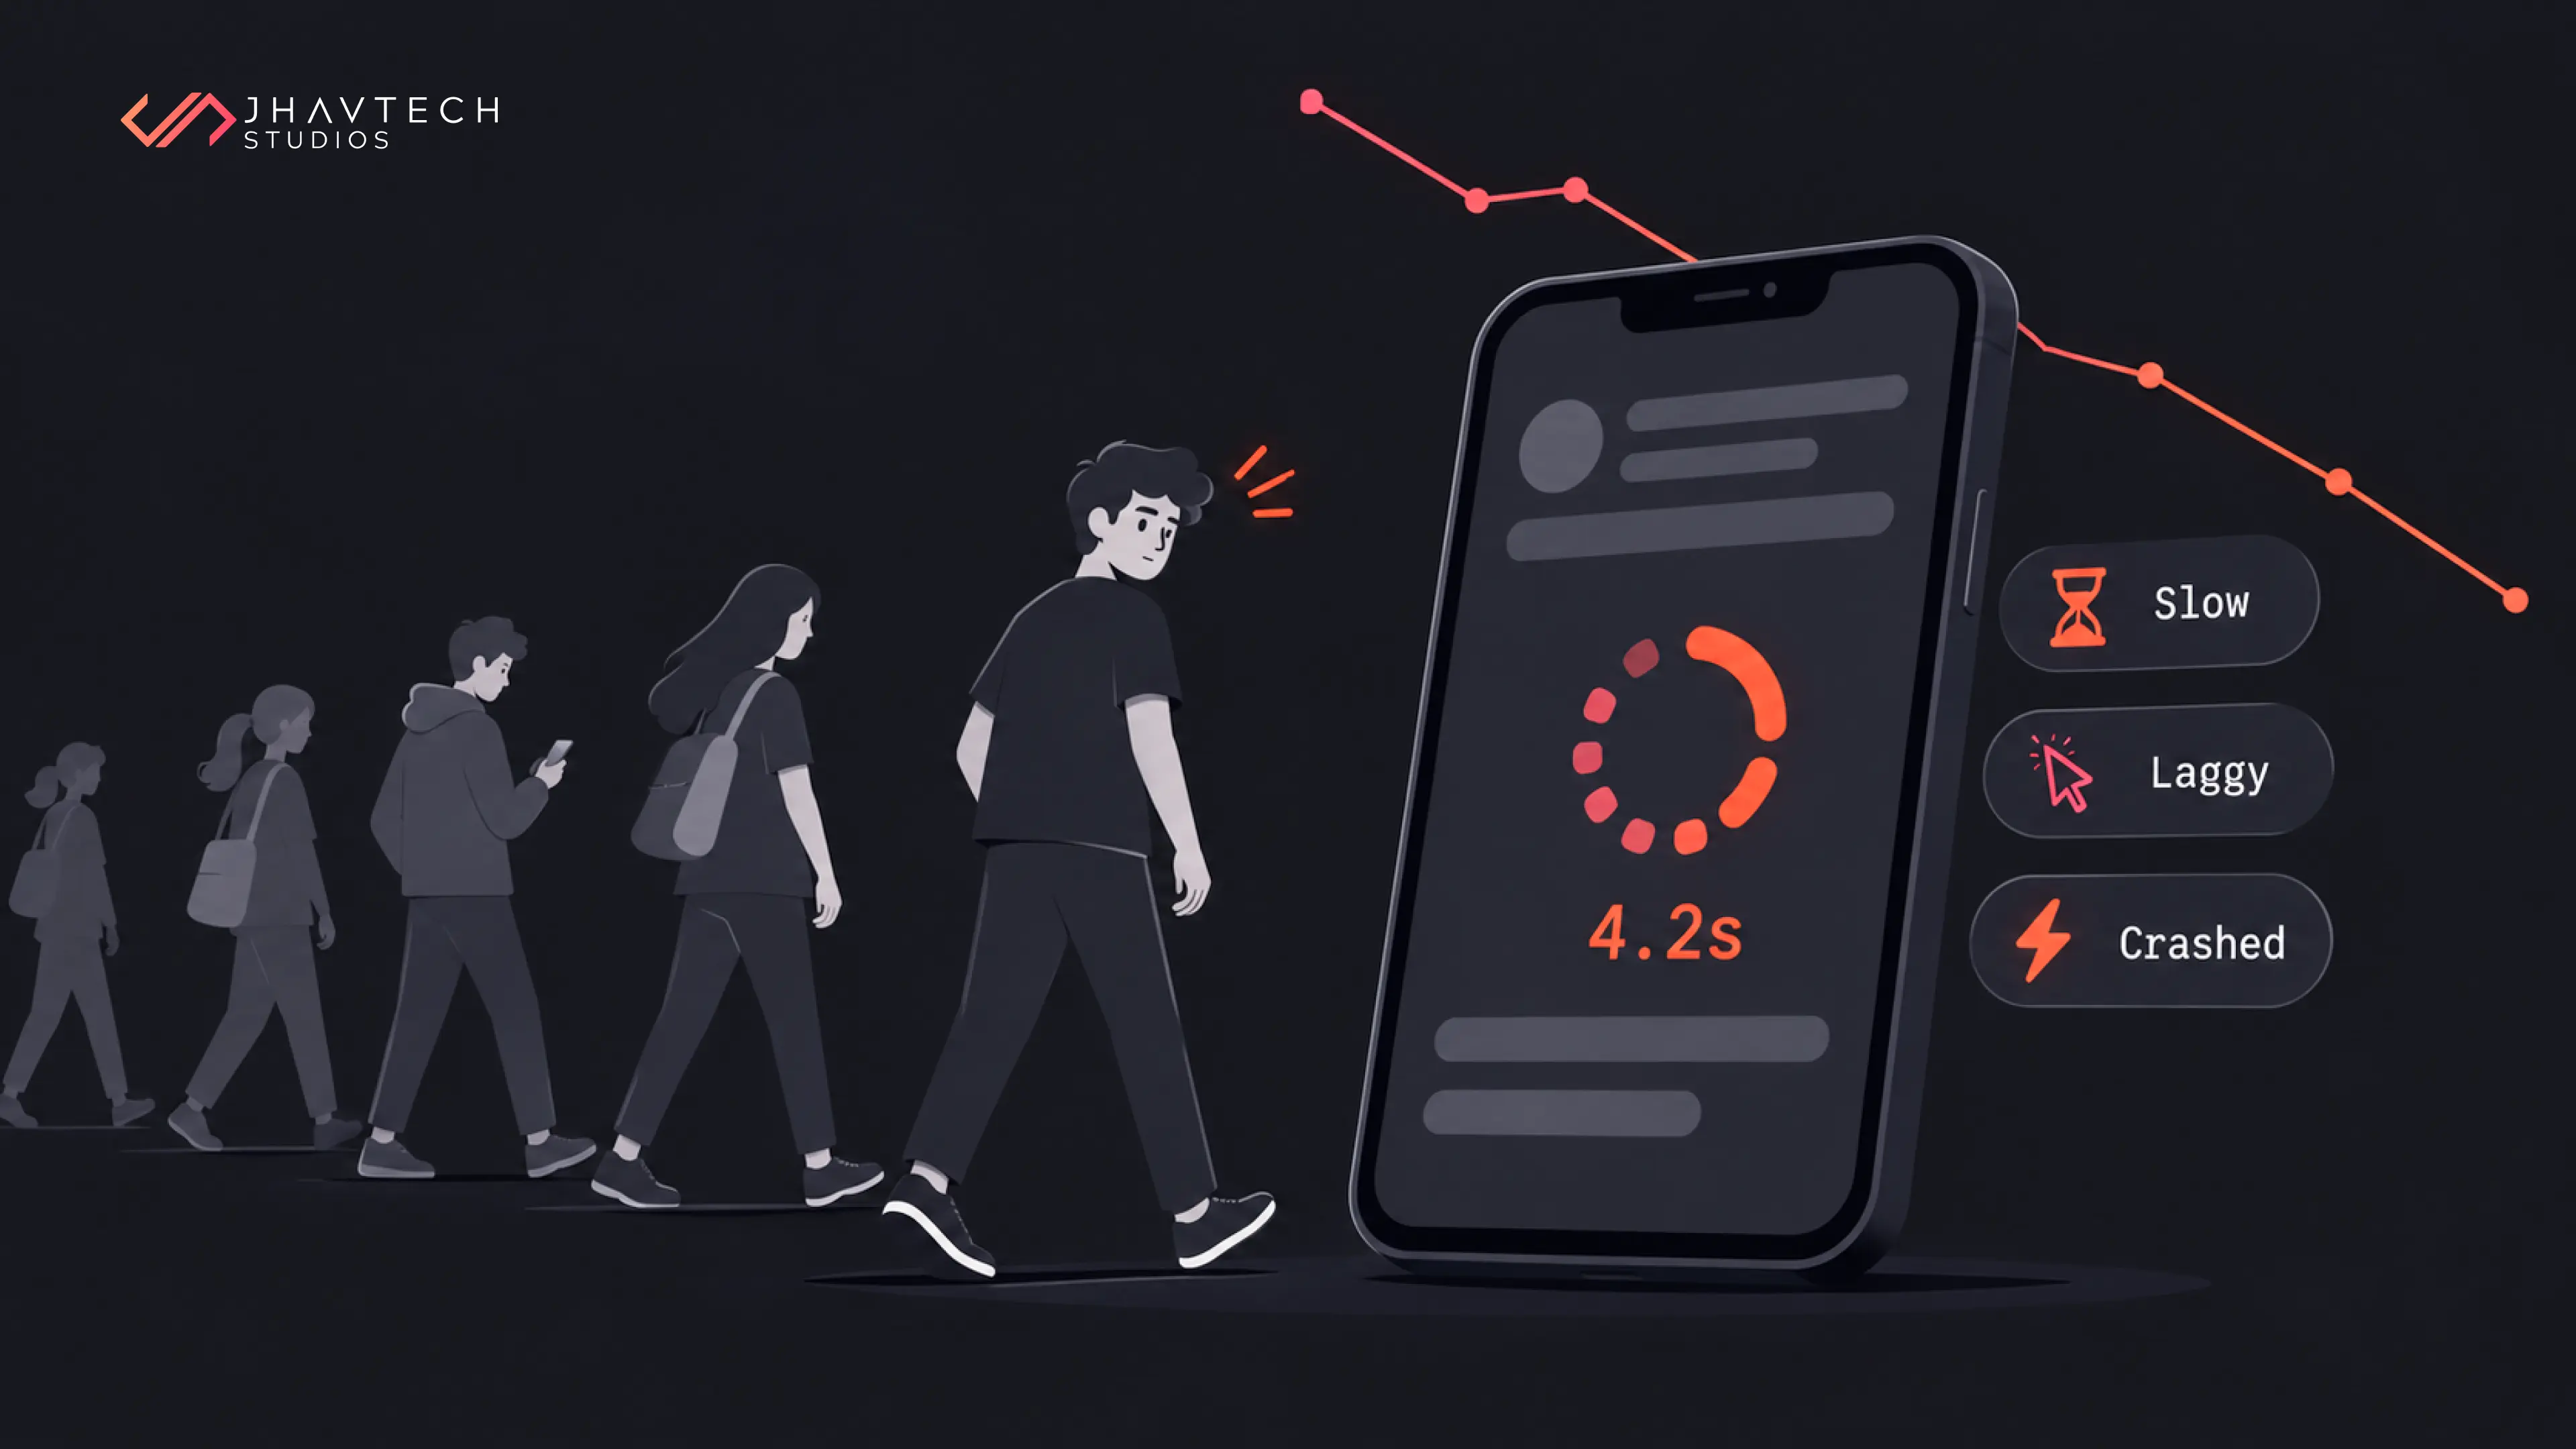
A fitness app came to us last year with a great feature list and a 2.4 star rating. We read six months of reviews. Almost nobody mentioned the features. They mentioned waiting.
"Takes forever to open." "Froze when I logged a session." "Gave up and used my watch instead."
The founder had been told this was a marketing problem. It was a four second cold start and a search screen that locked the interface every time someone typed. Two engineering tickets, both of them cheaper than a month of paid acquisition, and neither one on the roadmap because nothing was technically broken.
Performance problems rarely announce themselves, which is why they survive so long. Nothing breaks, so nothing gets escalated, and the retention curve flattens over months while the numbers that would have explained it sit in a dashboard nobody has opened since launch week.
Summary: What You Need to Know
Performance problems look like product problems. Users rarely say "your p95 latency is poor." They say the app is annoying, then they leave a two-star review and uninstall.
The thresholds are public, not a matter of taste. Google's Core Web Vitals put a good load at 2.5 seconds and a good response to a tap at 200 milliseconds, both measured at the 75th percentile of real users.
Google Play penalises instability directly. Exceed a 1.09% user-perceived crash rate or a 0.47% ANR rate and Play reduces your app's visibility in the store.
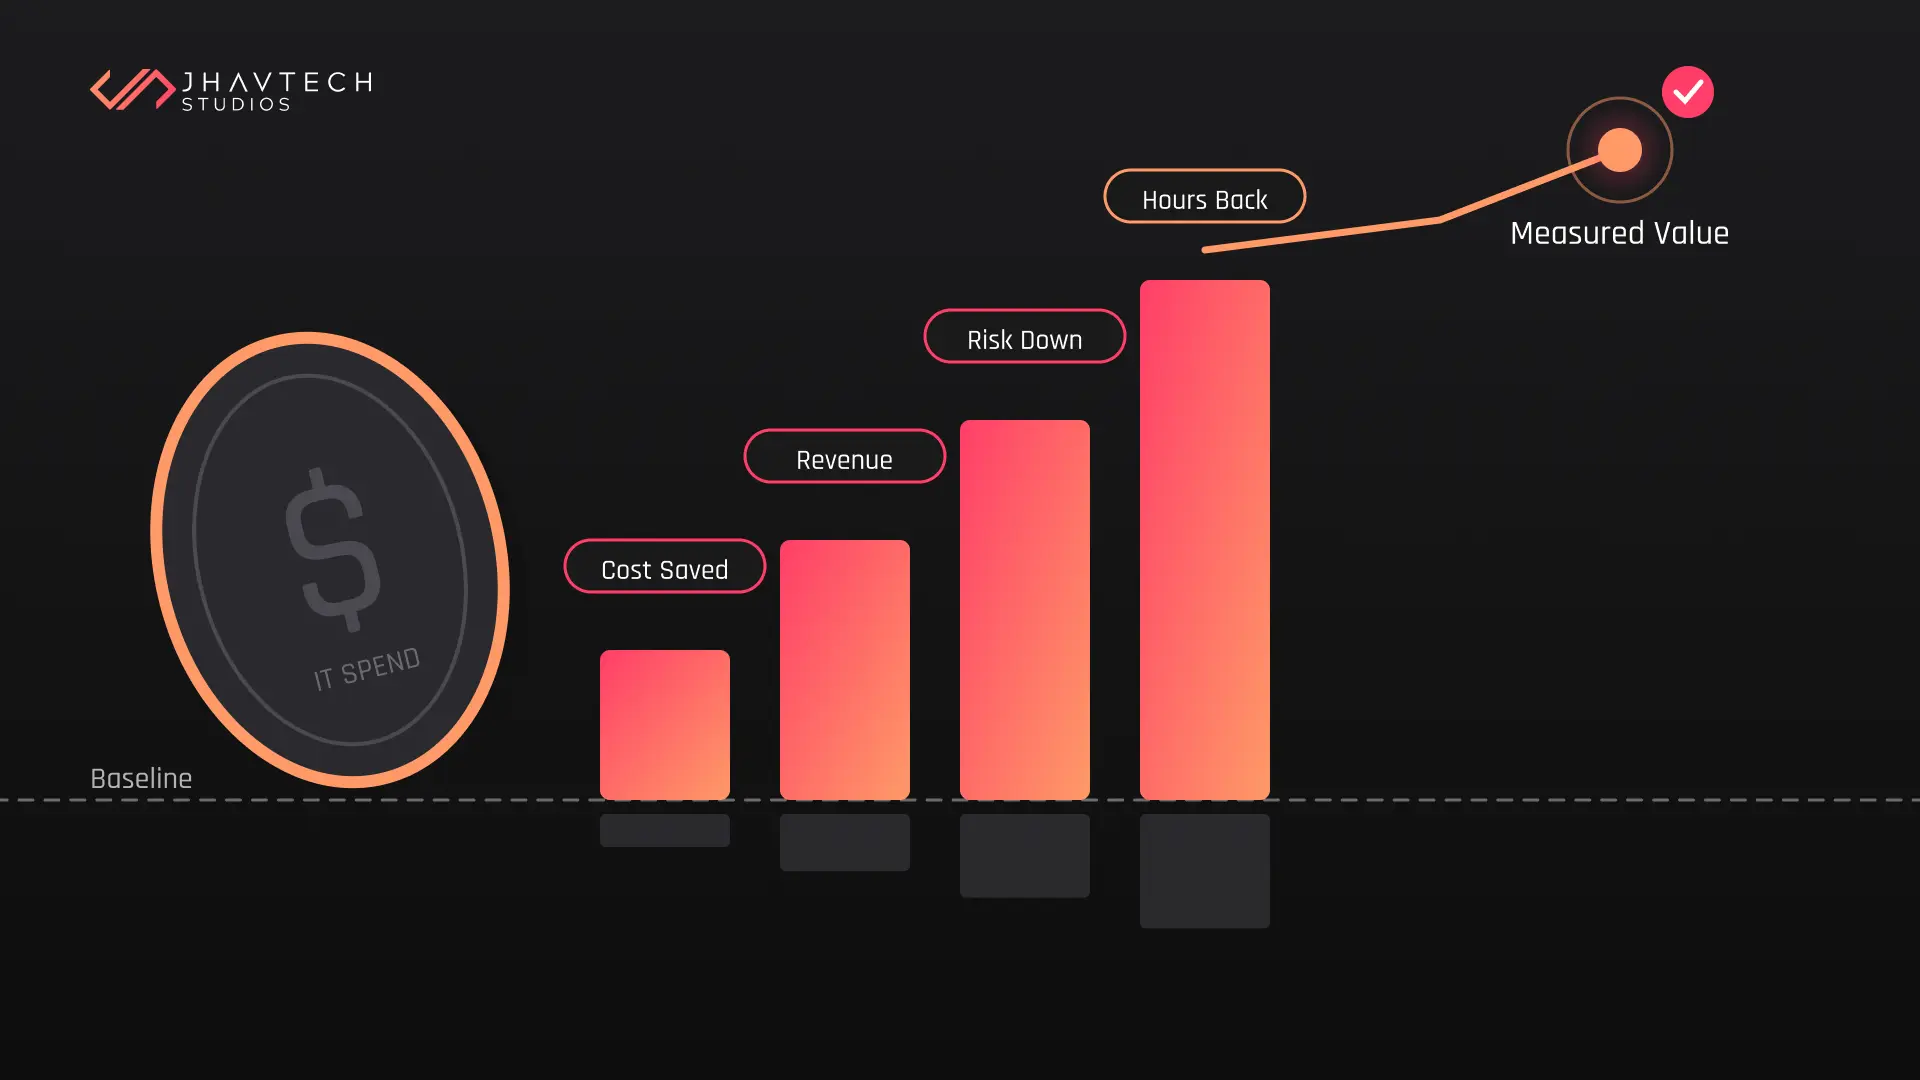
Small gains are worth real money. Google's study with Deloitte Digital across 30 million sessions found a 0.1 second mobile speed improvement lifted retail conversion rates by 8.4%.
Seven issues, in the order they usually bite: cold start, response after the tap, crashes and freezes, untested devices and networks, screens that slow as data grows, a heavy app, and no monitoring to catch any of it.
The diagnostic table and 10-point checklist below turn vague complaints into a list you can hand to your developers this week.
What Counts as an Application Performance Issue?
An application performance issue is any behaviour that makes your software slower, less responsive or less reliable than the user expects, without the software being formally broken. It is measured in milliseconds and percentages, and it is felt as impatience.
The distinction matters because of how teams triage. A bug has a reproduction, an owner and a fix. A performance issue has a shrug. It works on the developer's machine, it works on the demo, and the person who hit the two second delay never filed a ticket. They just stopped.
So these problems survive sprint after sprint, accumulating, until the retention graph flattens and nobody can point to the week it started. There was no week. There was a slope.
1. A Cold Start That Gives Users Time to Reconsider
Cold start is the time between a user tapping your icon and reaching a screen they can use. Google rates a web load of 2.5 seconds or less as good at the 75th percentile of real visits. For mobile apps, two seconds on a mid-range device is the working target.
This is the first thing anyone experiences and the thing teams measure least. Cold start is the gap between the tap on your icon and a screen the user can do something with. On the web, the equivalent is slow page loading, measured as Largest Contentful Paint.
Google's threshold for a good load is 2.5 seconds or less at the 75th percentile of real visits, with anything beyond 4 seconds rated poor (web.dev). Note the percentile. Your average might be 1.8 seconds while a quarter of your users sit through five.
What we find behind a slow start, in rough order of frequency:
- Everything happens on the launch path. Analytics SDKs, feature flags, remote config, a session refresh and three network calls, all before the first pixel.
- Images sized for a desktop monitor, shipped to a phone.
- A splash screen that waits for a server response rather than rendering cached content and updating quietly.
- Third-party scripts loaded synchronously because that was the integration guide's example.
The fix is usually sequencing rather than rewriting. Render something useful from local cache, then fill it in. Defer anything the user is not about to look at. Most of the apps we audit can halve their cold start without touching the architecture.
2. App Response Time That Lags Behind the Finger
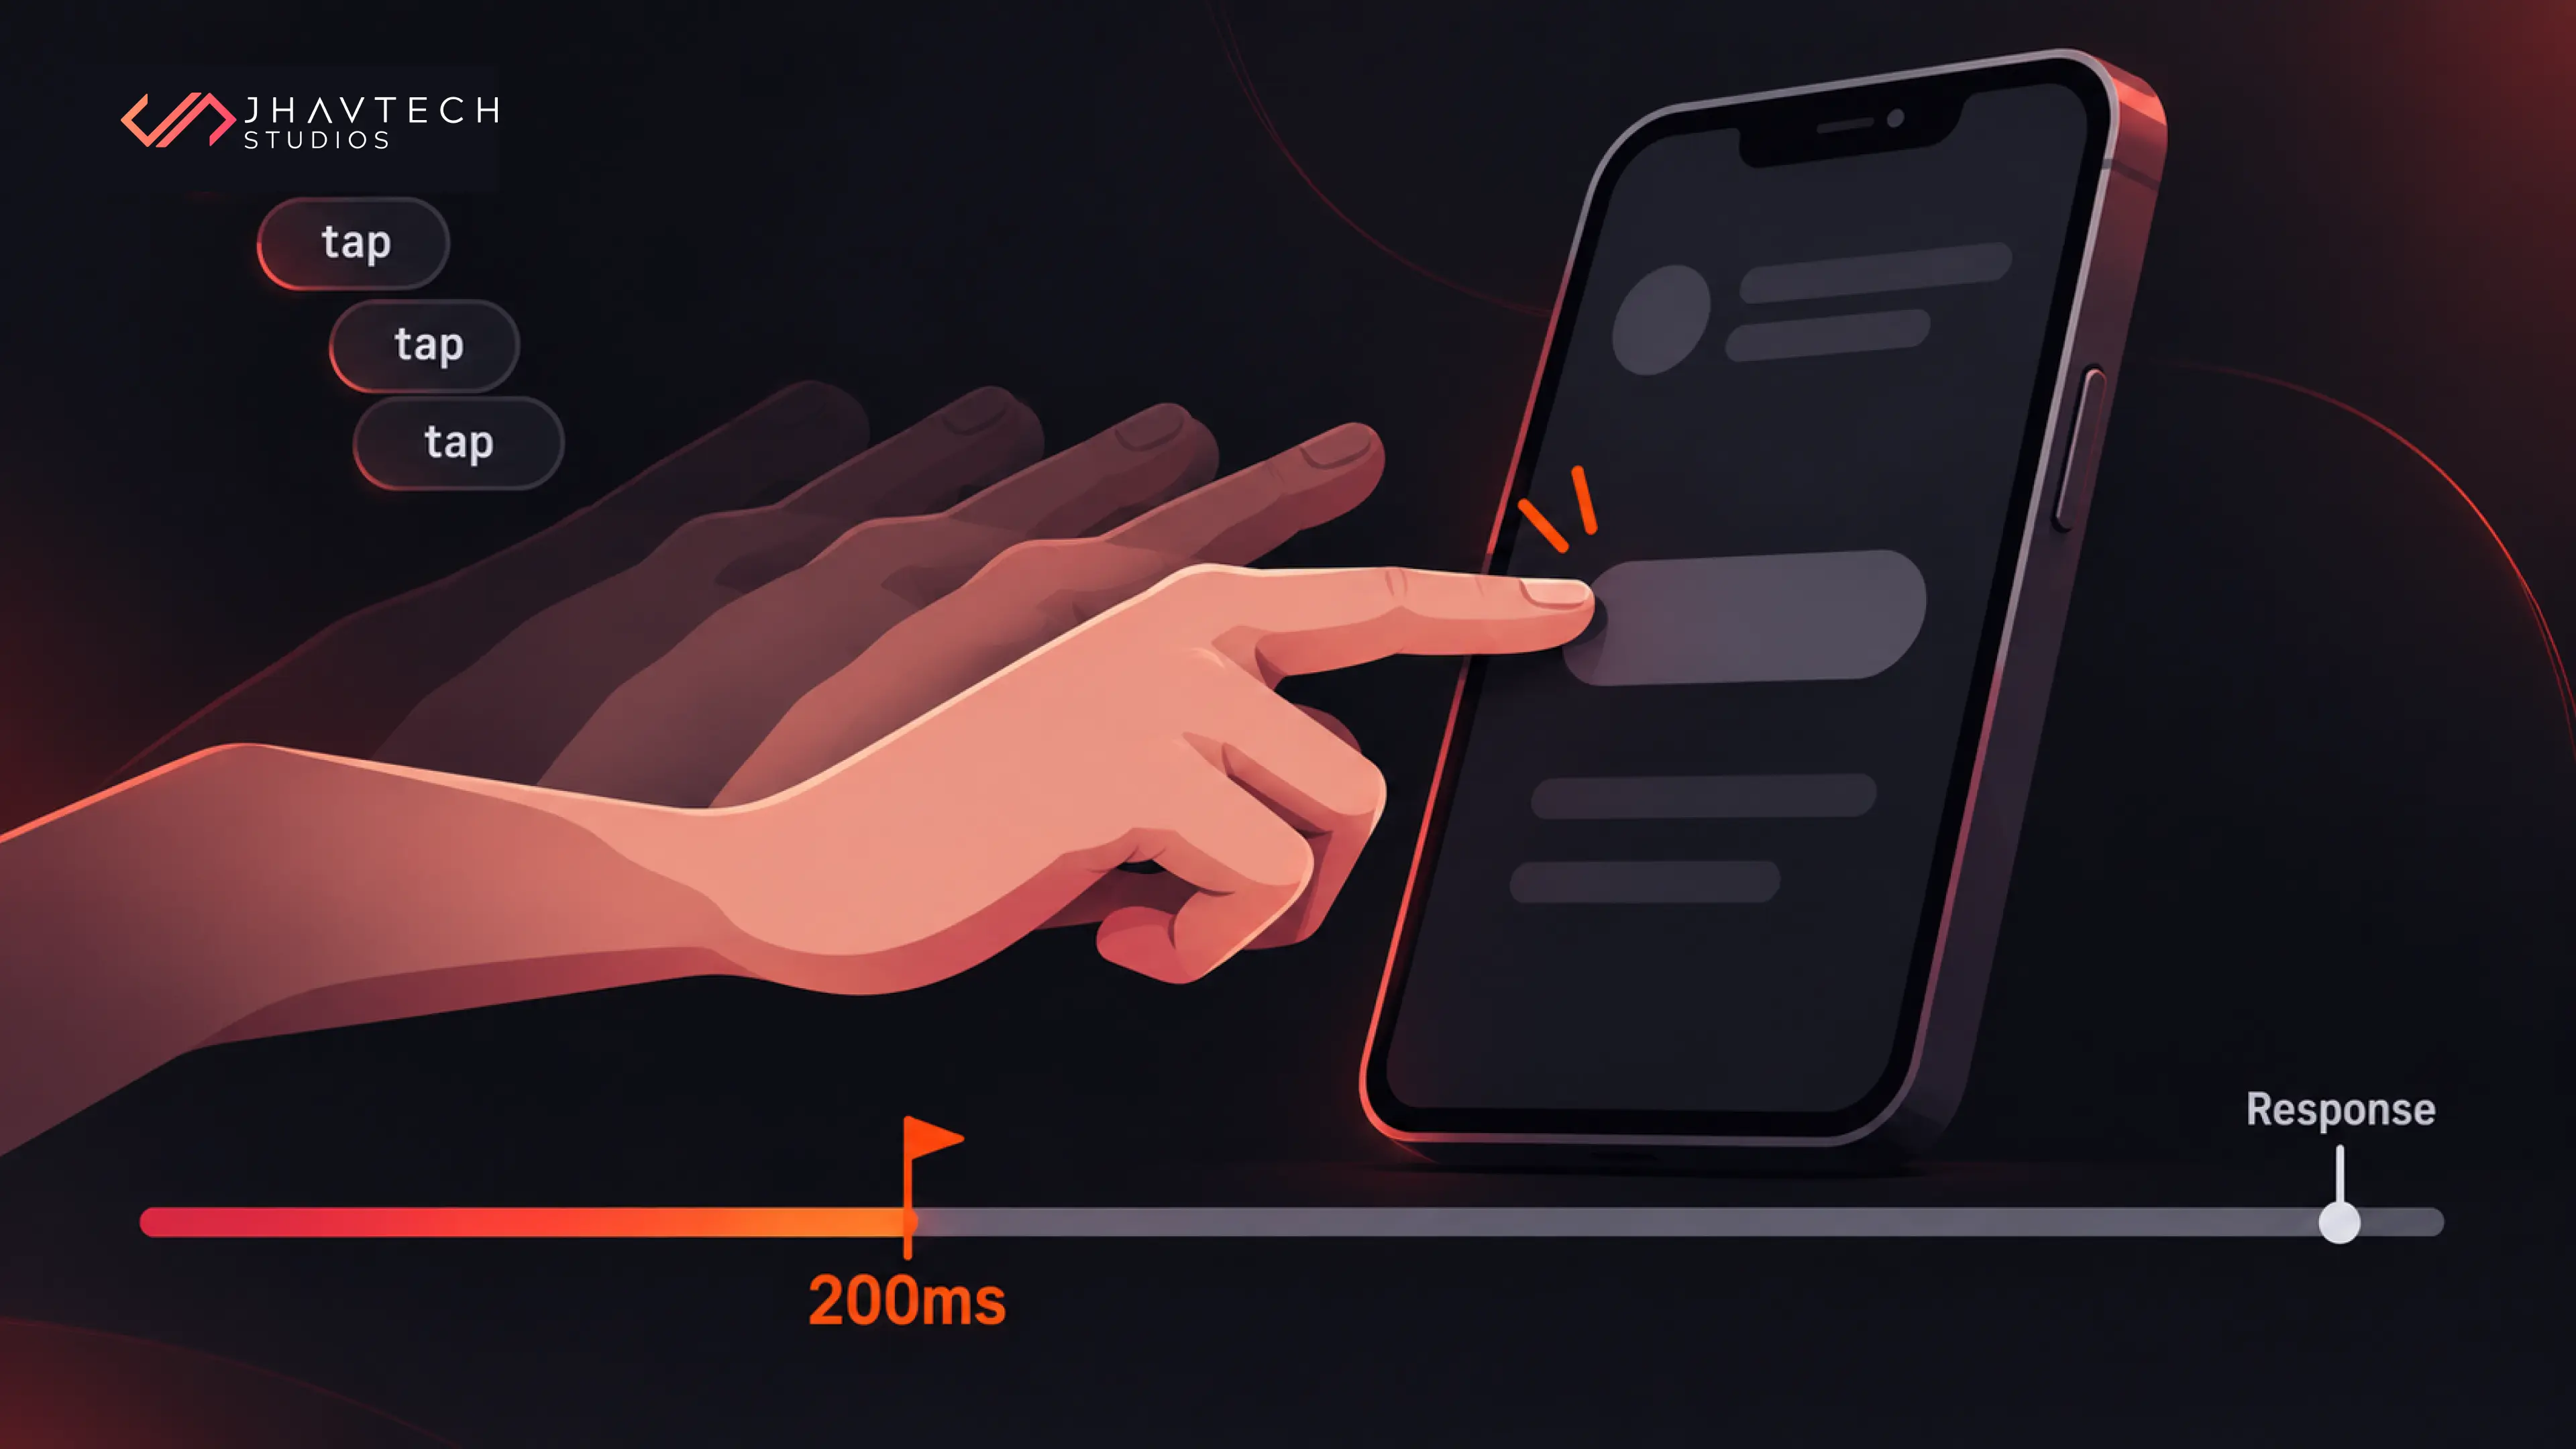
App response time is the delay between a tap and a visible change on screen. Google's Interaction to Next Paint metric sets the threshold at 200 milliseconds or less at the 75th percentile. Beyond roughly 500 milliseconds, users assume the tap failed and try it again.
Load speed gets the attention. App response time is what people remember, because it happens on every single interaction rather than once per session.
Google's responsiveness metric, Interaction to Next Paint, sets the bar at 200 milliseconds or less from tap to visible update (web.dev). Past about half a second, people start tapping again, which queues a second event, which makes it slower. You have all watched someone do this to a lift button.
The usual culprits are work done on the main thread when it did not need to be: parsing a large payload, rendering a list without recycling, running a search across everything on every keystroke, or re-rendering a whole screen because one value changed.
The cheapest win here is acknowledgement rather than speed. If a tap cannot complete in 200 milliseconds, it can still respond in 200 milliseconds. Change the button state. Show the row as pending. Users forgive a slow operation far more readily than they forgive silence, and this is user experience optimisation at its most basic: tell people the machine heard them.
3. Mobile App Crashes, and the Freezes That Are Worse
A crash ends the app. A freeze leaves it on screen and unresponsive, which Android reports as an ANR. Google Play treats a user-perceived crash rate above 1.09%, or an ANR rate above 0.47%, as bad behaviour and can reduce the app's visibility in the store.
Mobile app crashes are the one performance issue everyone agrees is serious. Freezes deserve the same treatment and rarely get it.
At least a crash is unambiguous: the app disappears, the user knows something went wrong, and your crash reporter sends you a stack trace within minutes. A freeze tells nobody anything. The screen stays there, the taps do nothing, and on Android the user eventually gets a dialogue asking whether they want to close your app. Google calls this an ANR, short for Application Not Responding. There is no stack trace waiting in your inbox, and the user tends to blame themselves or their phone before they blame you.
Google Play has published hard numbers for both. A user-perceived crash rate above 1.09%, or a user-perceived ANR rate above 0.47%, puts your app past what Play calls the bad behaviour threshold, and Play may reduce your visibility in the store as a result (Android Developers).
Which makes stability an acquisition problem as much as a retention one, and that is not usually how founders have it filed. An ANR rate of 0.5% means roughly one in two hundred of your daily users watches your app die every day, and it also means fewer new users find you in the first place.
If you are tracking crash-free sessions and feeling comfortable at 99%, check the user-perceived numbers in Play Console instead. They count differently, and they are the ones that affect your ranking.
4. Performance Measured on the Wrong Phone and the Wrong Network
Device and network coverage gaps occur when an app is only ever tested on recent hardware and fast connections. Identical code behaves differently on a three-year-old mid-range Android running on mobile data, which describes a large share of Australian users outside the capital city CBDs.
Your developers test on a current-model phone, on office wifi, against a staging database with four hundred records. Your users are on a three-year-old mid-range Android, on patchy mobile data in a car park, against a database with two million rows.
In practical terms, those are two different applications that happen to share a codebase.
This gap shows up as reviews that make no sense to your team. The app is fine. The app is not fine for the person holding a phone with a slower processor, less memory and a browser that is two versions behind. In Australia this bites harder than founders expect, because coverage outside the capital city CBDs is uneven and your regional customers are not on the connection you designed for.
Closing the gap costs almost nothing, as long as someone owns it:
- Buy two cheap phones. A mid-range Android and an older iPhone. Every release gets opened on both before it ships. This single change surfaces more real problems than most monitoring tools.
- Throttle the network in testing. Chrome DevTools and Xcode both simulate slow connections. Run your main flow on a simulated 3G connection once a sprint.
- Seed test data at production scale. A list screen that flies through 200 records and crawls through 20,000 is a problem you can only find with 20,000 records.
5. Screens That Slow Down as Your Data Grows
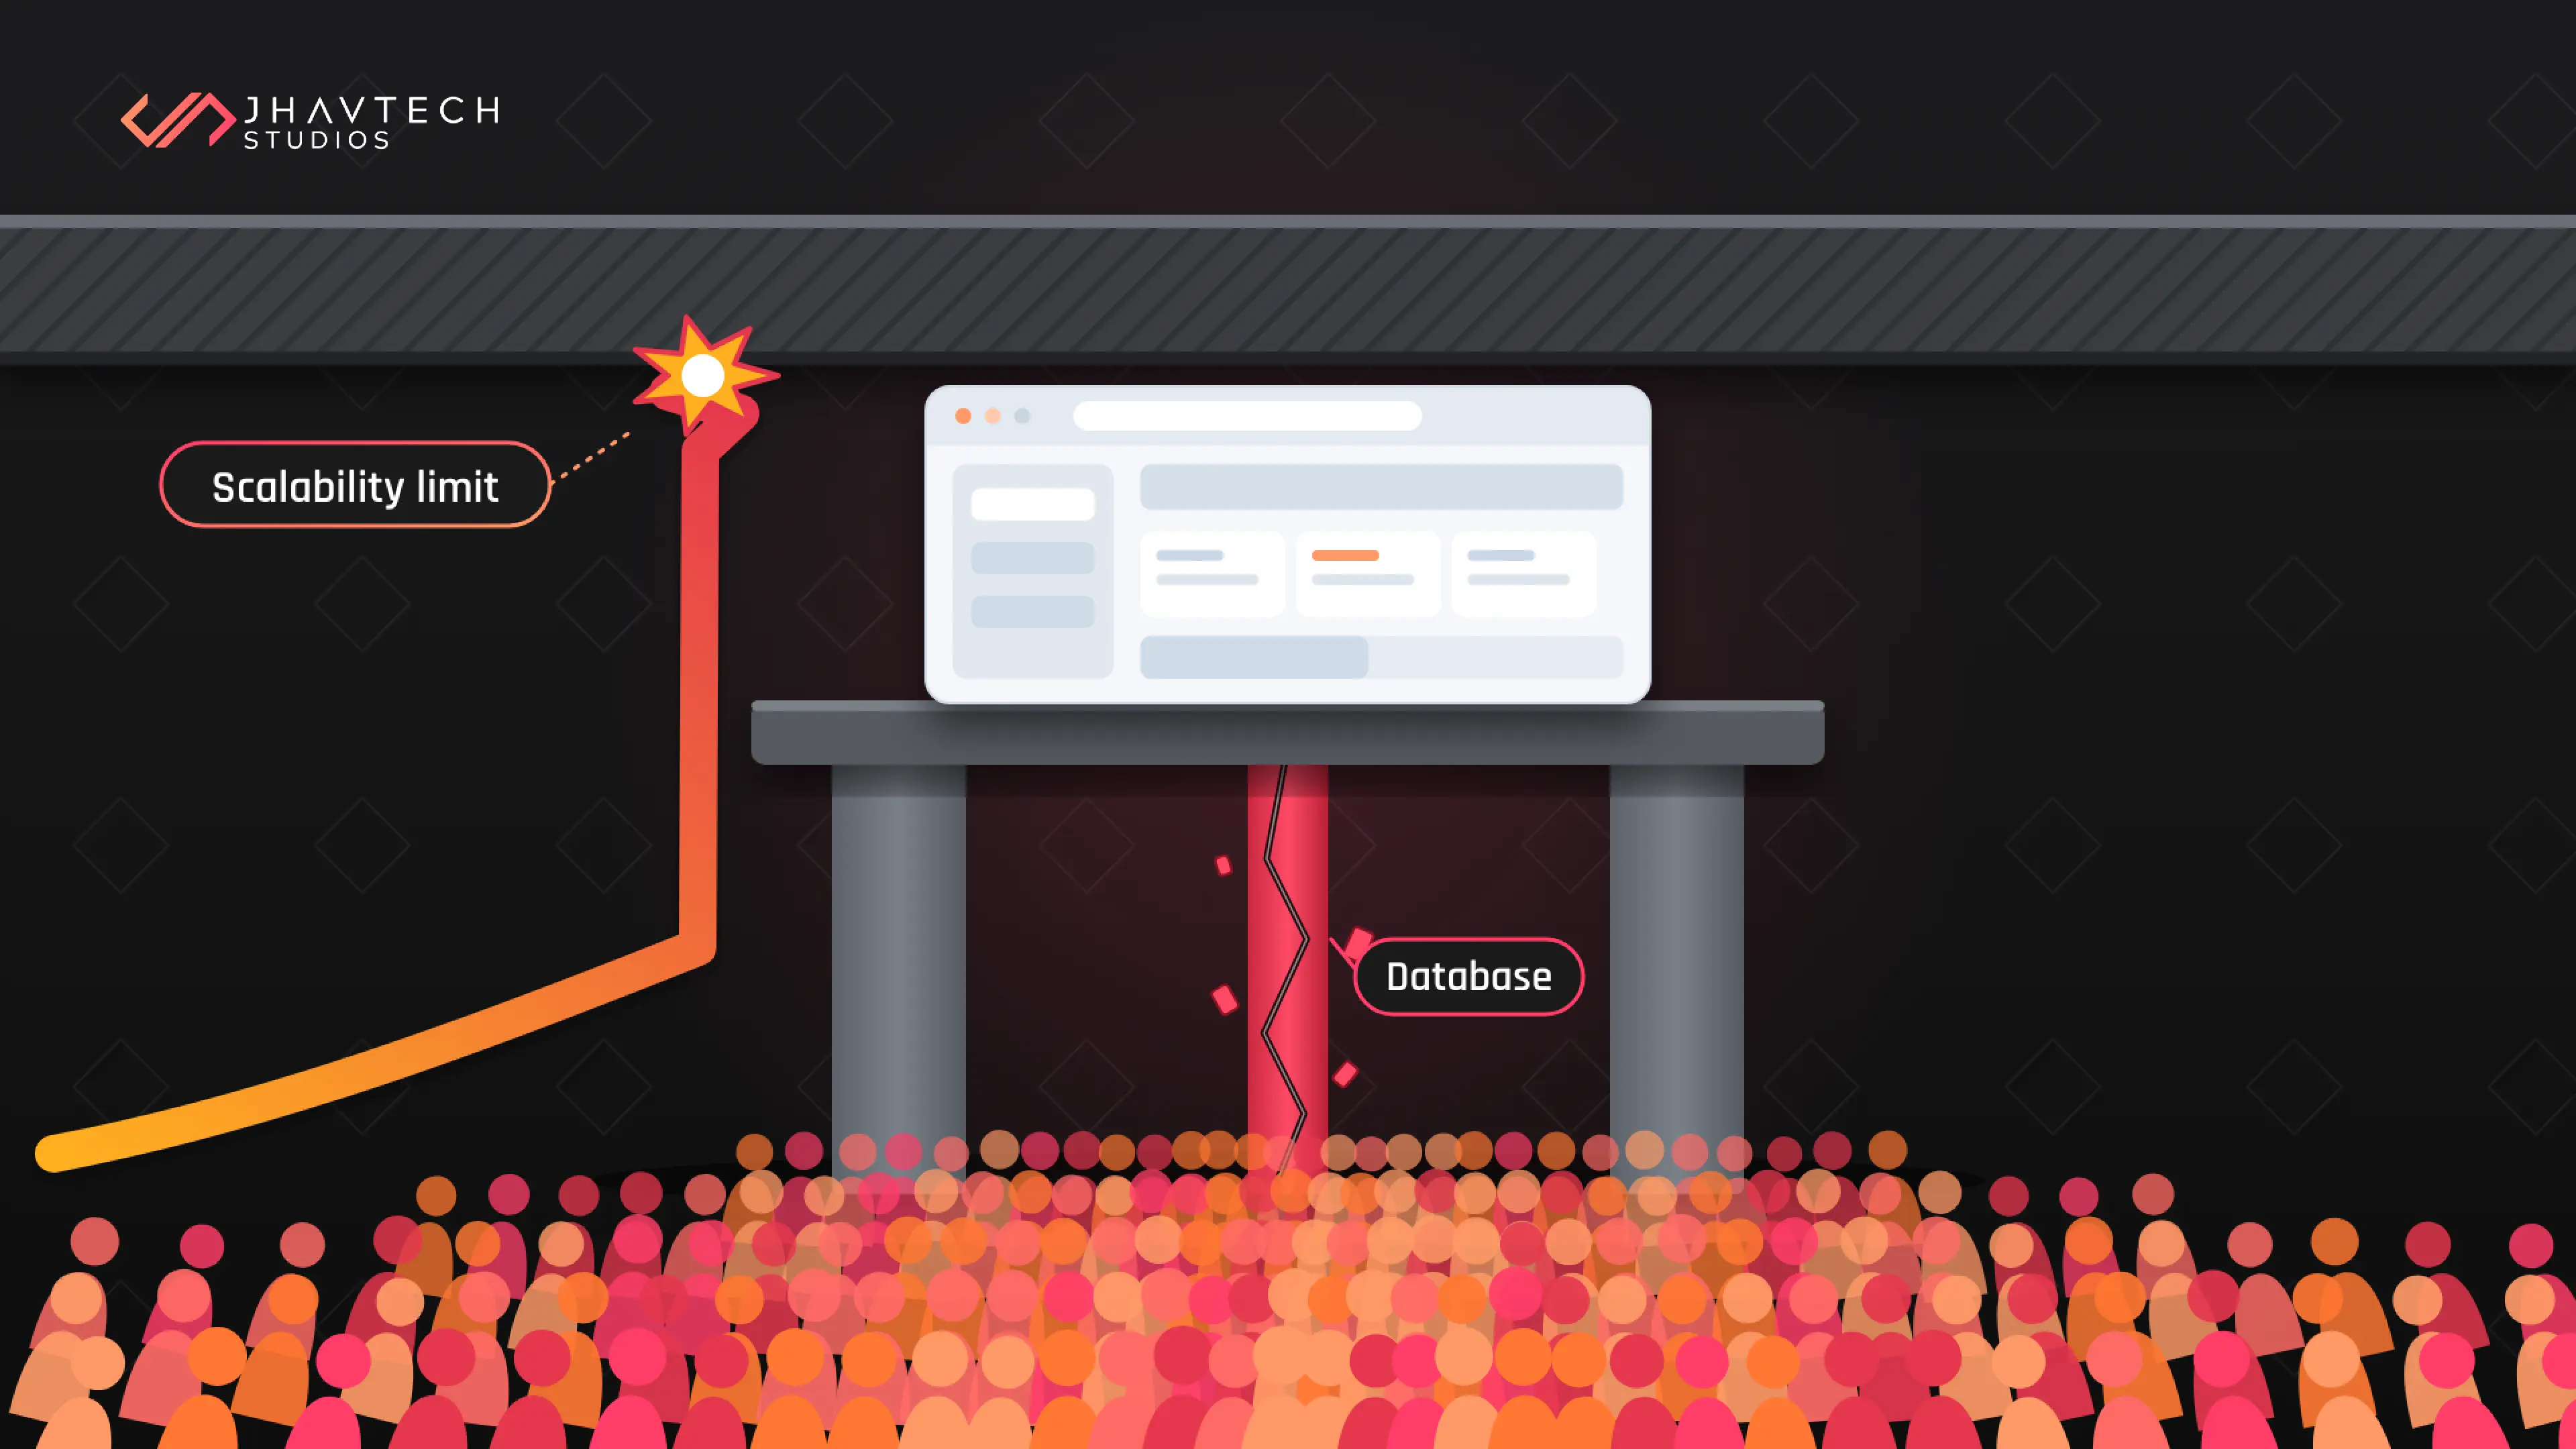
A data growth problem is one where query time rises with row count instead of staying flat. Unindexed queries, N+1 patterns and missing pagination are the usual causes, and they surface first among your longest-standing customers, because they hold the most records.
This is the issue that makes a successful app feel worse than a failing one, which is a special kind of unfair.
At launch, every screen is quick, because there is nothing in the database. Eighteen months later the same screen is fetching a user's full history, and the query that took 8 milliseconds against 500 rows takes 2 seconds against 500,000. Nobody changed the code. The code was always going to do this.
The technical causes are boring and consistent. Queries running without an index. The N+1 pattern, where loading a list of 100 items fires 101 separate database calls instead of two. Pagination that was never built because the first customers only ever had a dozen records. A dashboard recalculating every figure on page load rather than overnight.
The tell is a complaint that correlates with tenure. If your longest-standing customers, the ones with the most data and the most to lose, are the ones saying the app has got slower, you have found it. Those are also the accounts you can least afford to annoy.
We covered how to find the exact point where this tips over in how to know when your app has reached its scalability limits.
6. An App That Is Simply Too Heavy
Resource cost is what your app takes from the device: battery, mobile data and storage. Both iOS and Android show users which apps are draining their battery, and Google Play flags excessive battery usage above 1% of sessions as bad behaviour alongside crashes and ANRs.
Performance is not only speed. It is also what your app costs the person running it, in battery, in mobile data and in storage.
Battery drain is the quiet killer, because the operating system tells on you. Both iOS and Android show users which apps are eating their battery, and that screen is a very short path to an uninstall. The usual causes are background location updates at higher frequency than anyone needs, polling loops that should be push notifications, and wake locks that never get released.
Install size matters more than most teams assume. Someone on a cheap phone with no storage left and a limited data plan is making a judgement about whether your app is worth the room. Every unused SDK you shipped is sitting in that calculation.
Mobile data is the third tax. Pulling a full dataset when the screen shows ten rows, re-downloading images that should have been cached, syncing on every app open rather than on change. None of this is visible to you. All of it is visible to the user when their phone bill arrives.
7. Nobody Finds Out Until the One-Star Review
A monitoring gap means performance data reaches you as customer complaints rather than as instrumentation. Crash reporting on its own is not enough. Without real-user monitoring and percentile tracking, gradual degradation stays invisible until it shows up in reviews, support volume or churn.
This one is less a problem in its own right than the condition that lets the other six go unnoticed for years.
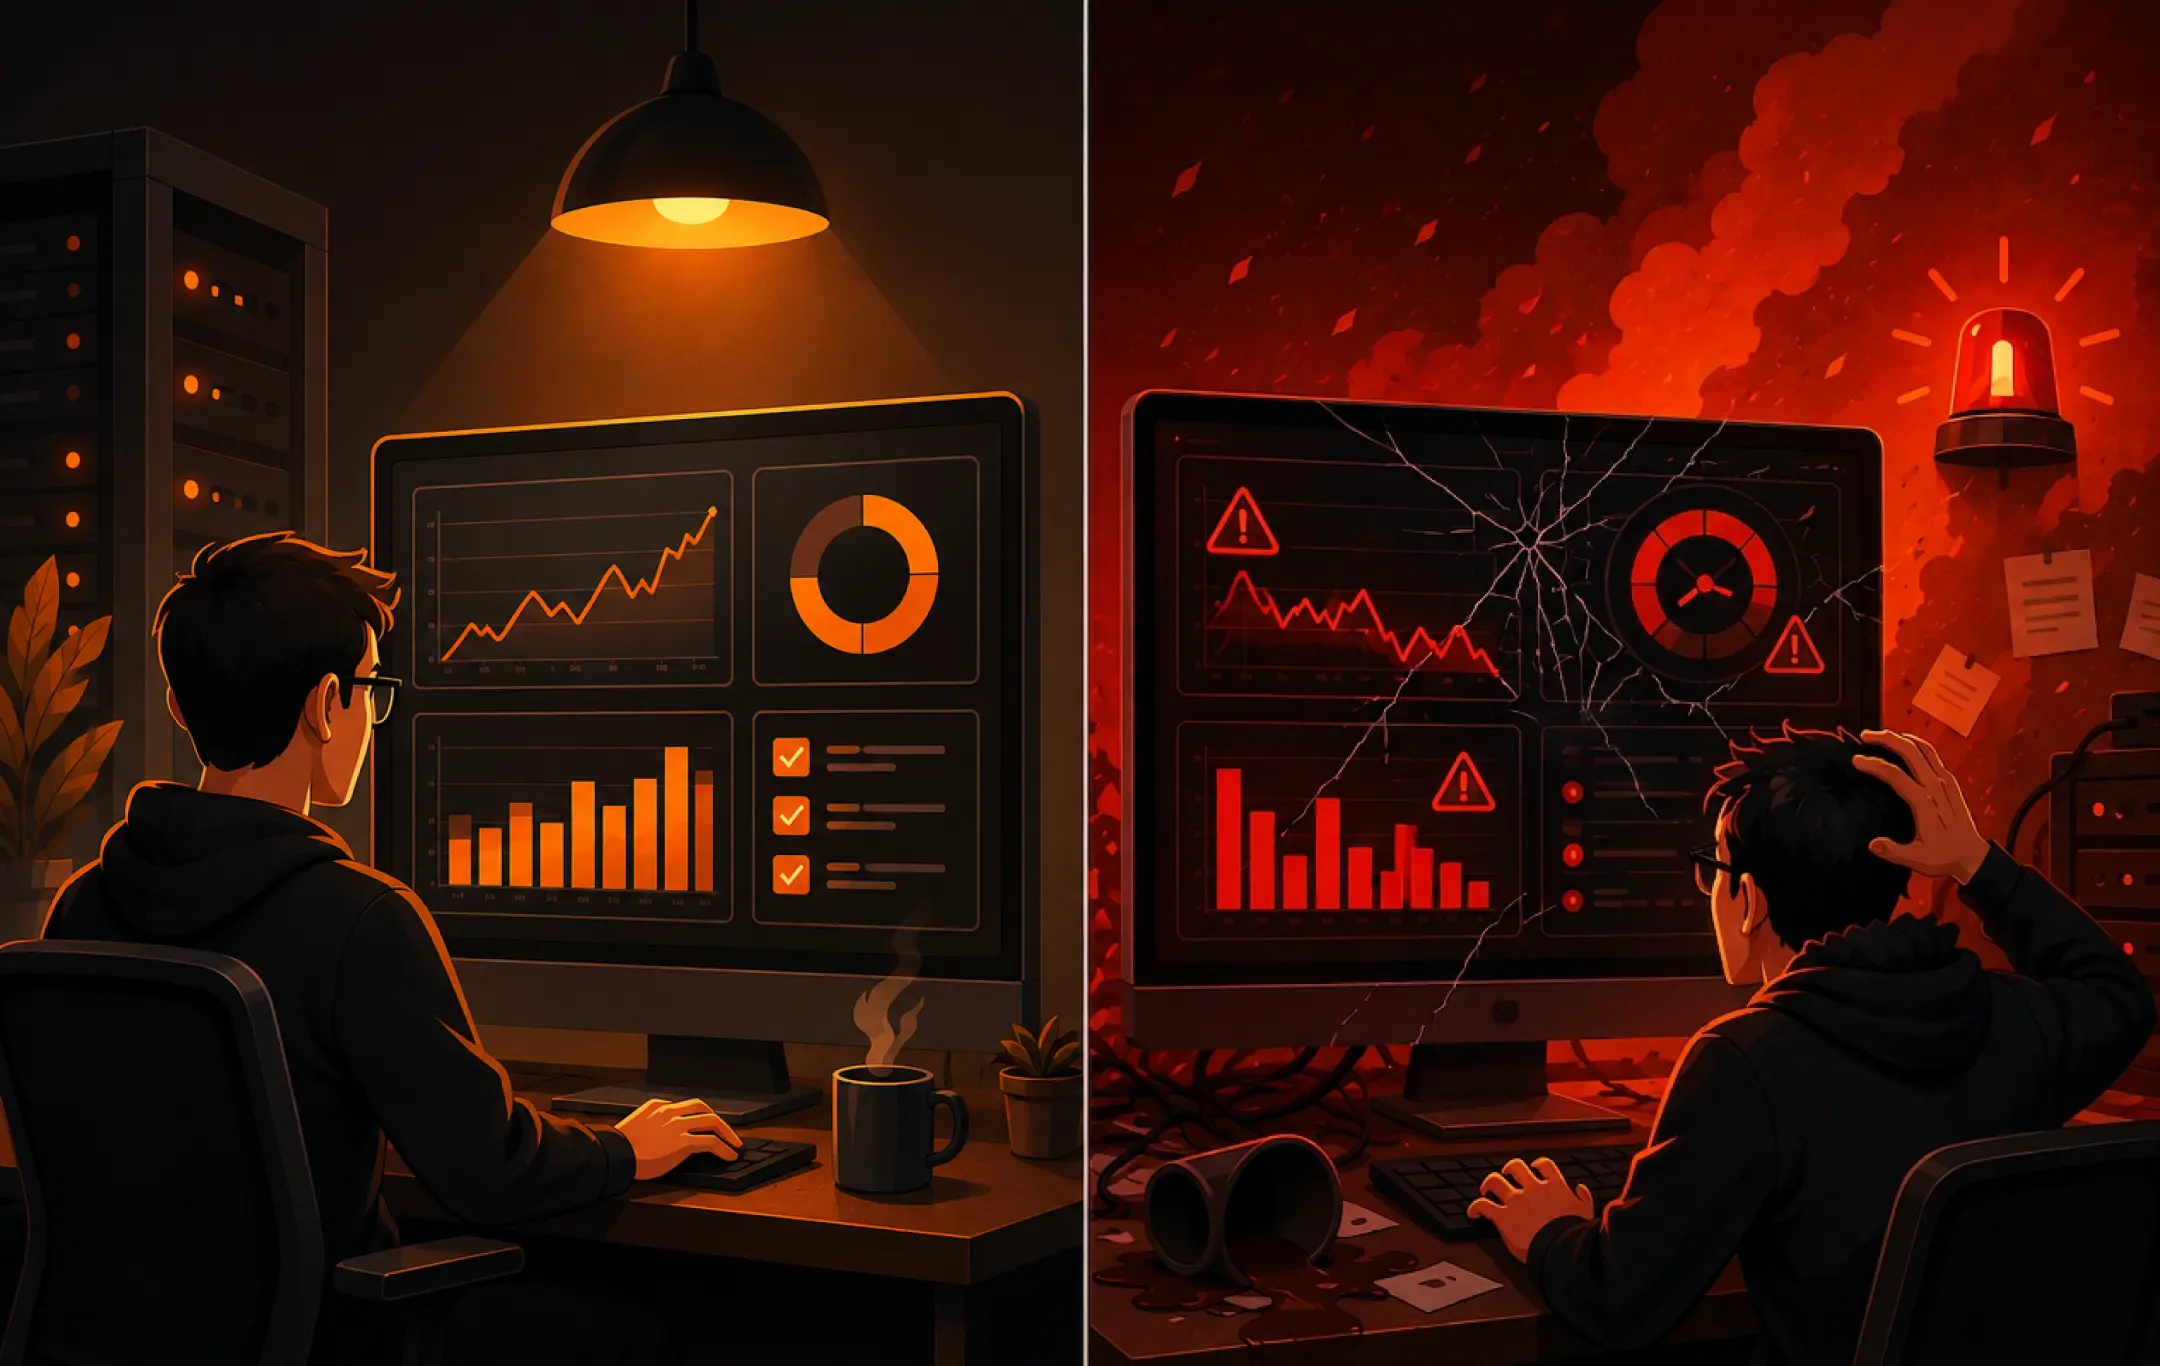
Most SME teams we meet have crash reporting and nothing else. No real-user monitoring, no percentile tracking, no alert when the checkout flow gets slower. Performance data arrives as customer complaints, which is the slowest and most expensive feedback loop available.
When monitoring does exist, it is usually tracking averages. An average hides exactly the users you need to know about. If nine people load a screen in 400 milliseconds and the tenth waits six seconds, your average looks respectable and your tenth user has left. Track p95 and p99 instead. Those numbers describe your worst experiences, and your worst experiences are what gets written in the reviews.
The cost of flying blind has risen. Splunk research published through Cisco in 2026 puts the average cost of downtime at US$15,000 per minute, with unplanned downtime costing Global 2000 companies around US$600 billion a year (Cisco Newsroom). An SME will not lose $15,000 a minute. An SME will lose the enterprise prospect who was trialling the product the morning it froze.
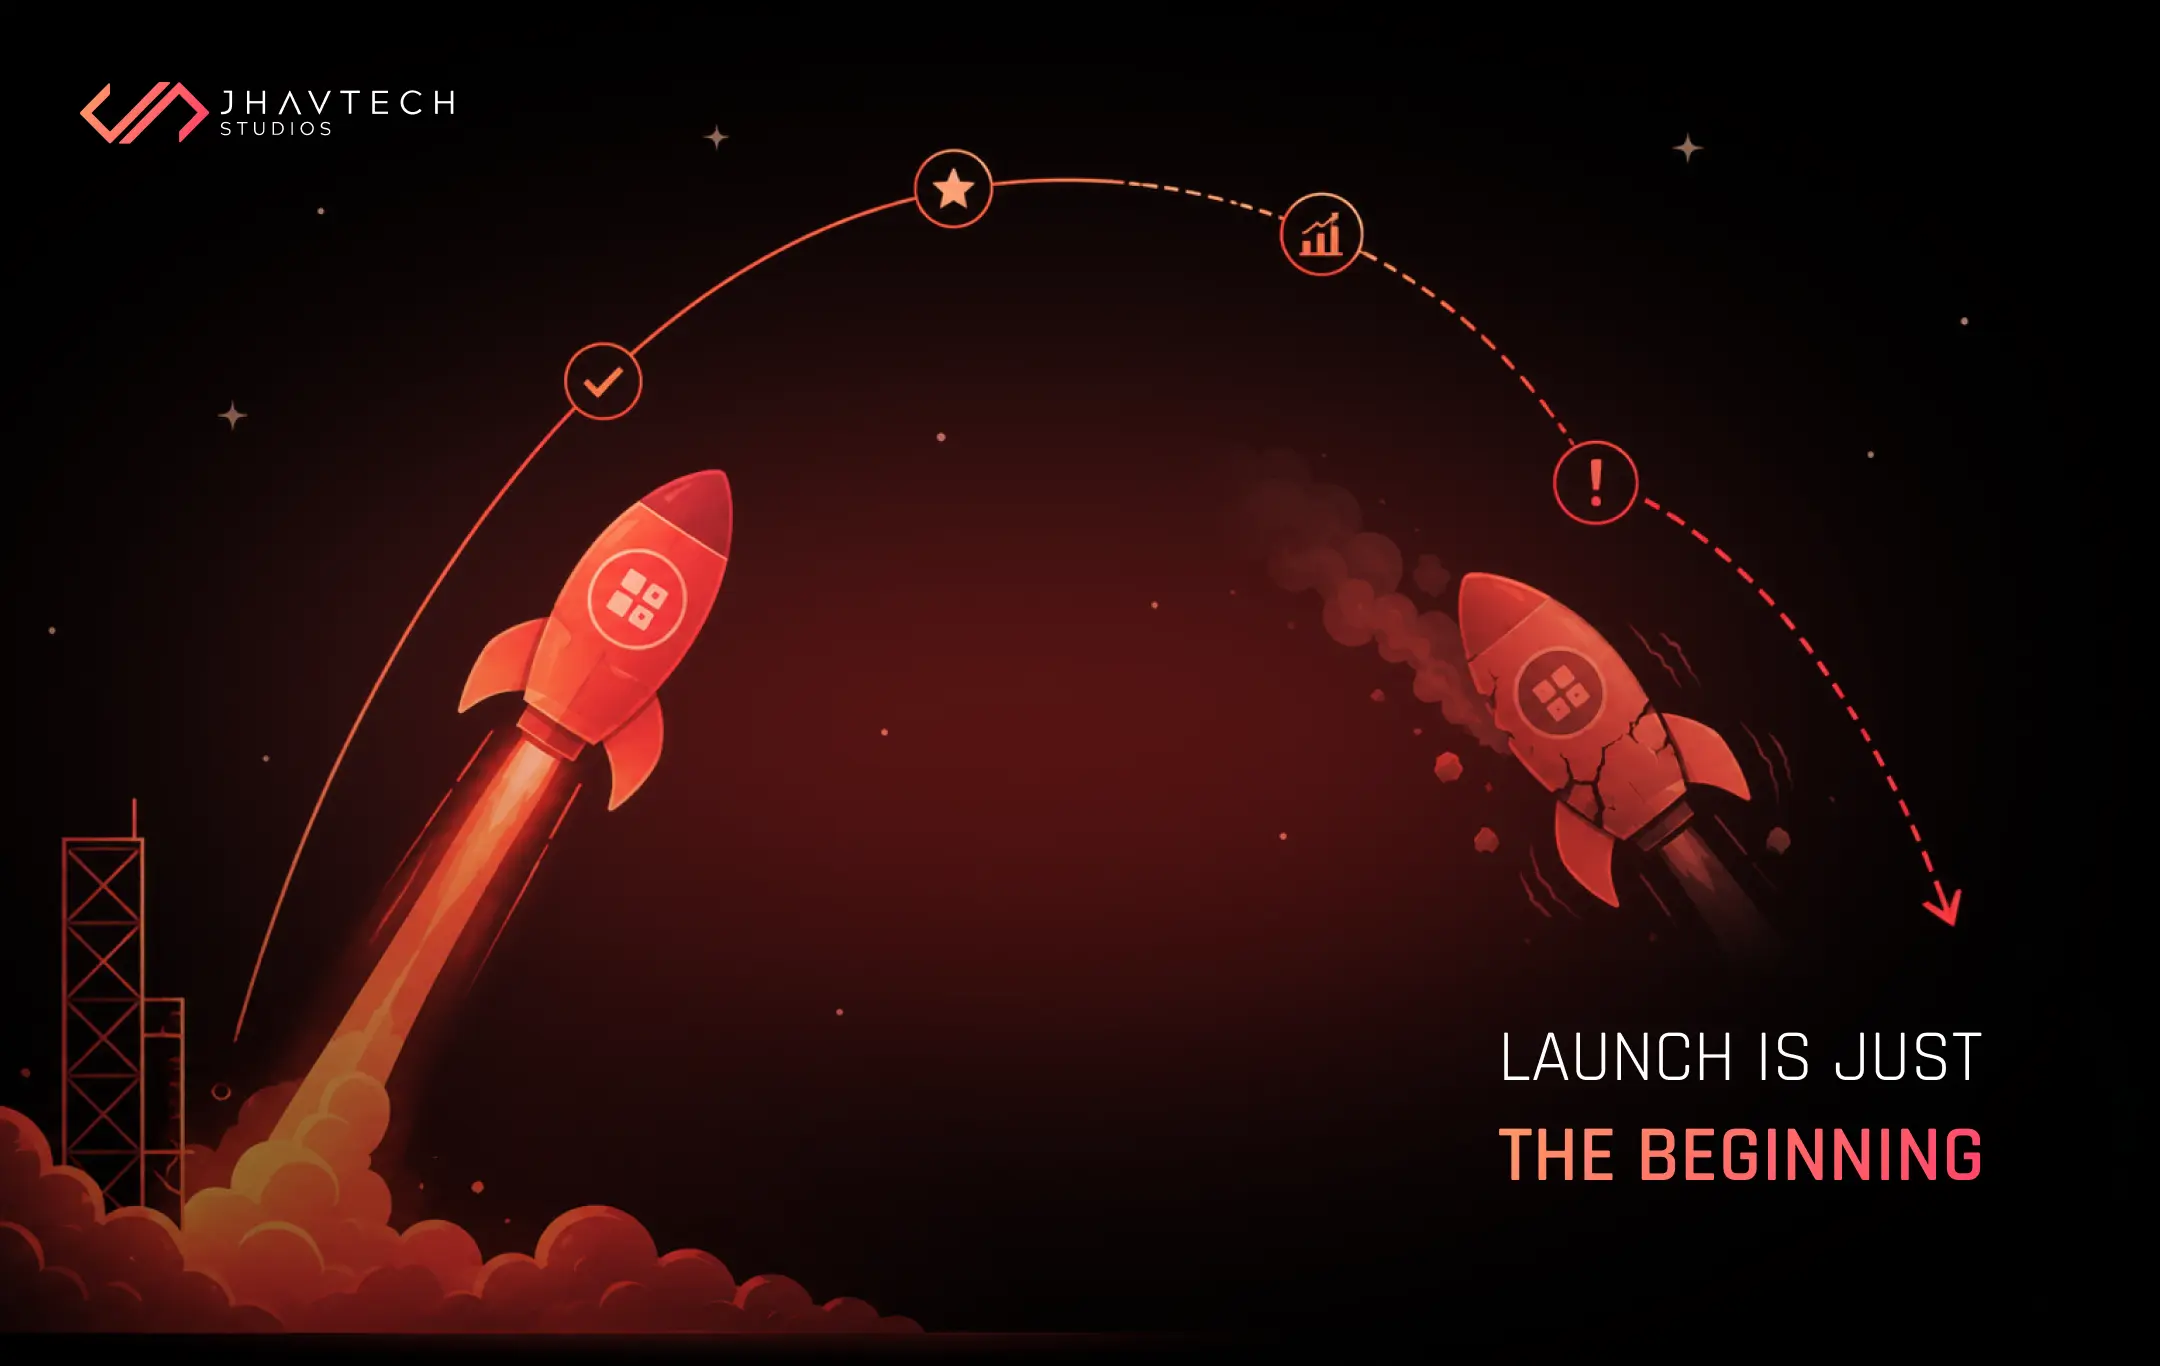
We wrote more about what gets neglected after launch in why most apps struggle after launch.
Matching the Complaint to the Cause
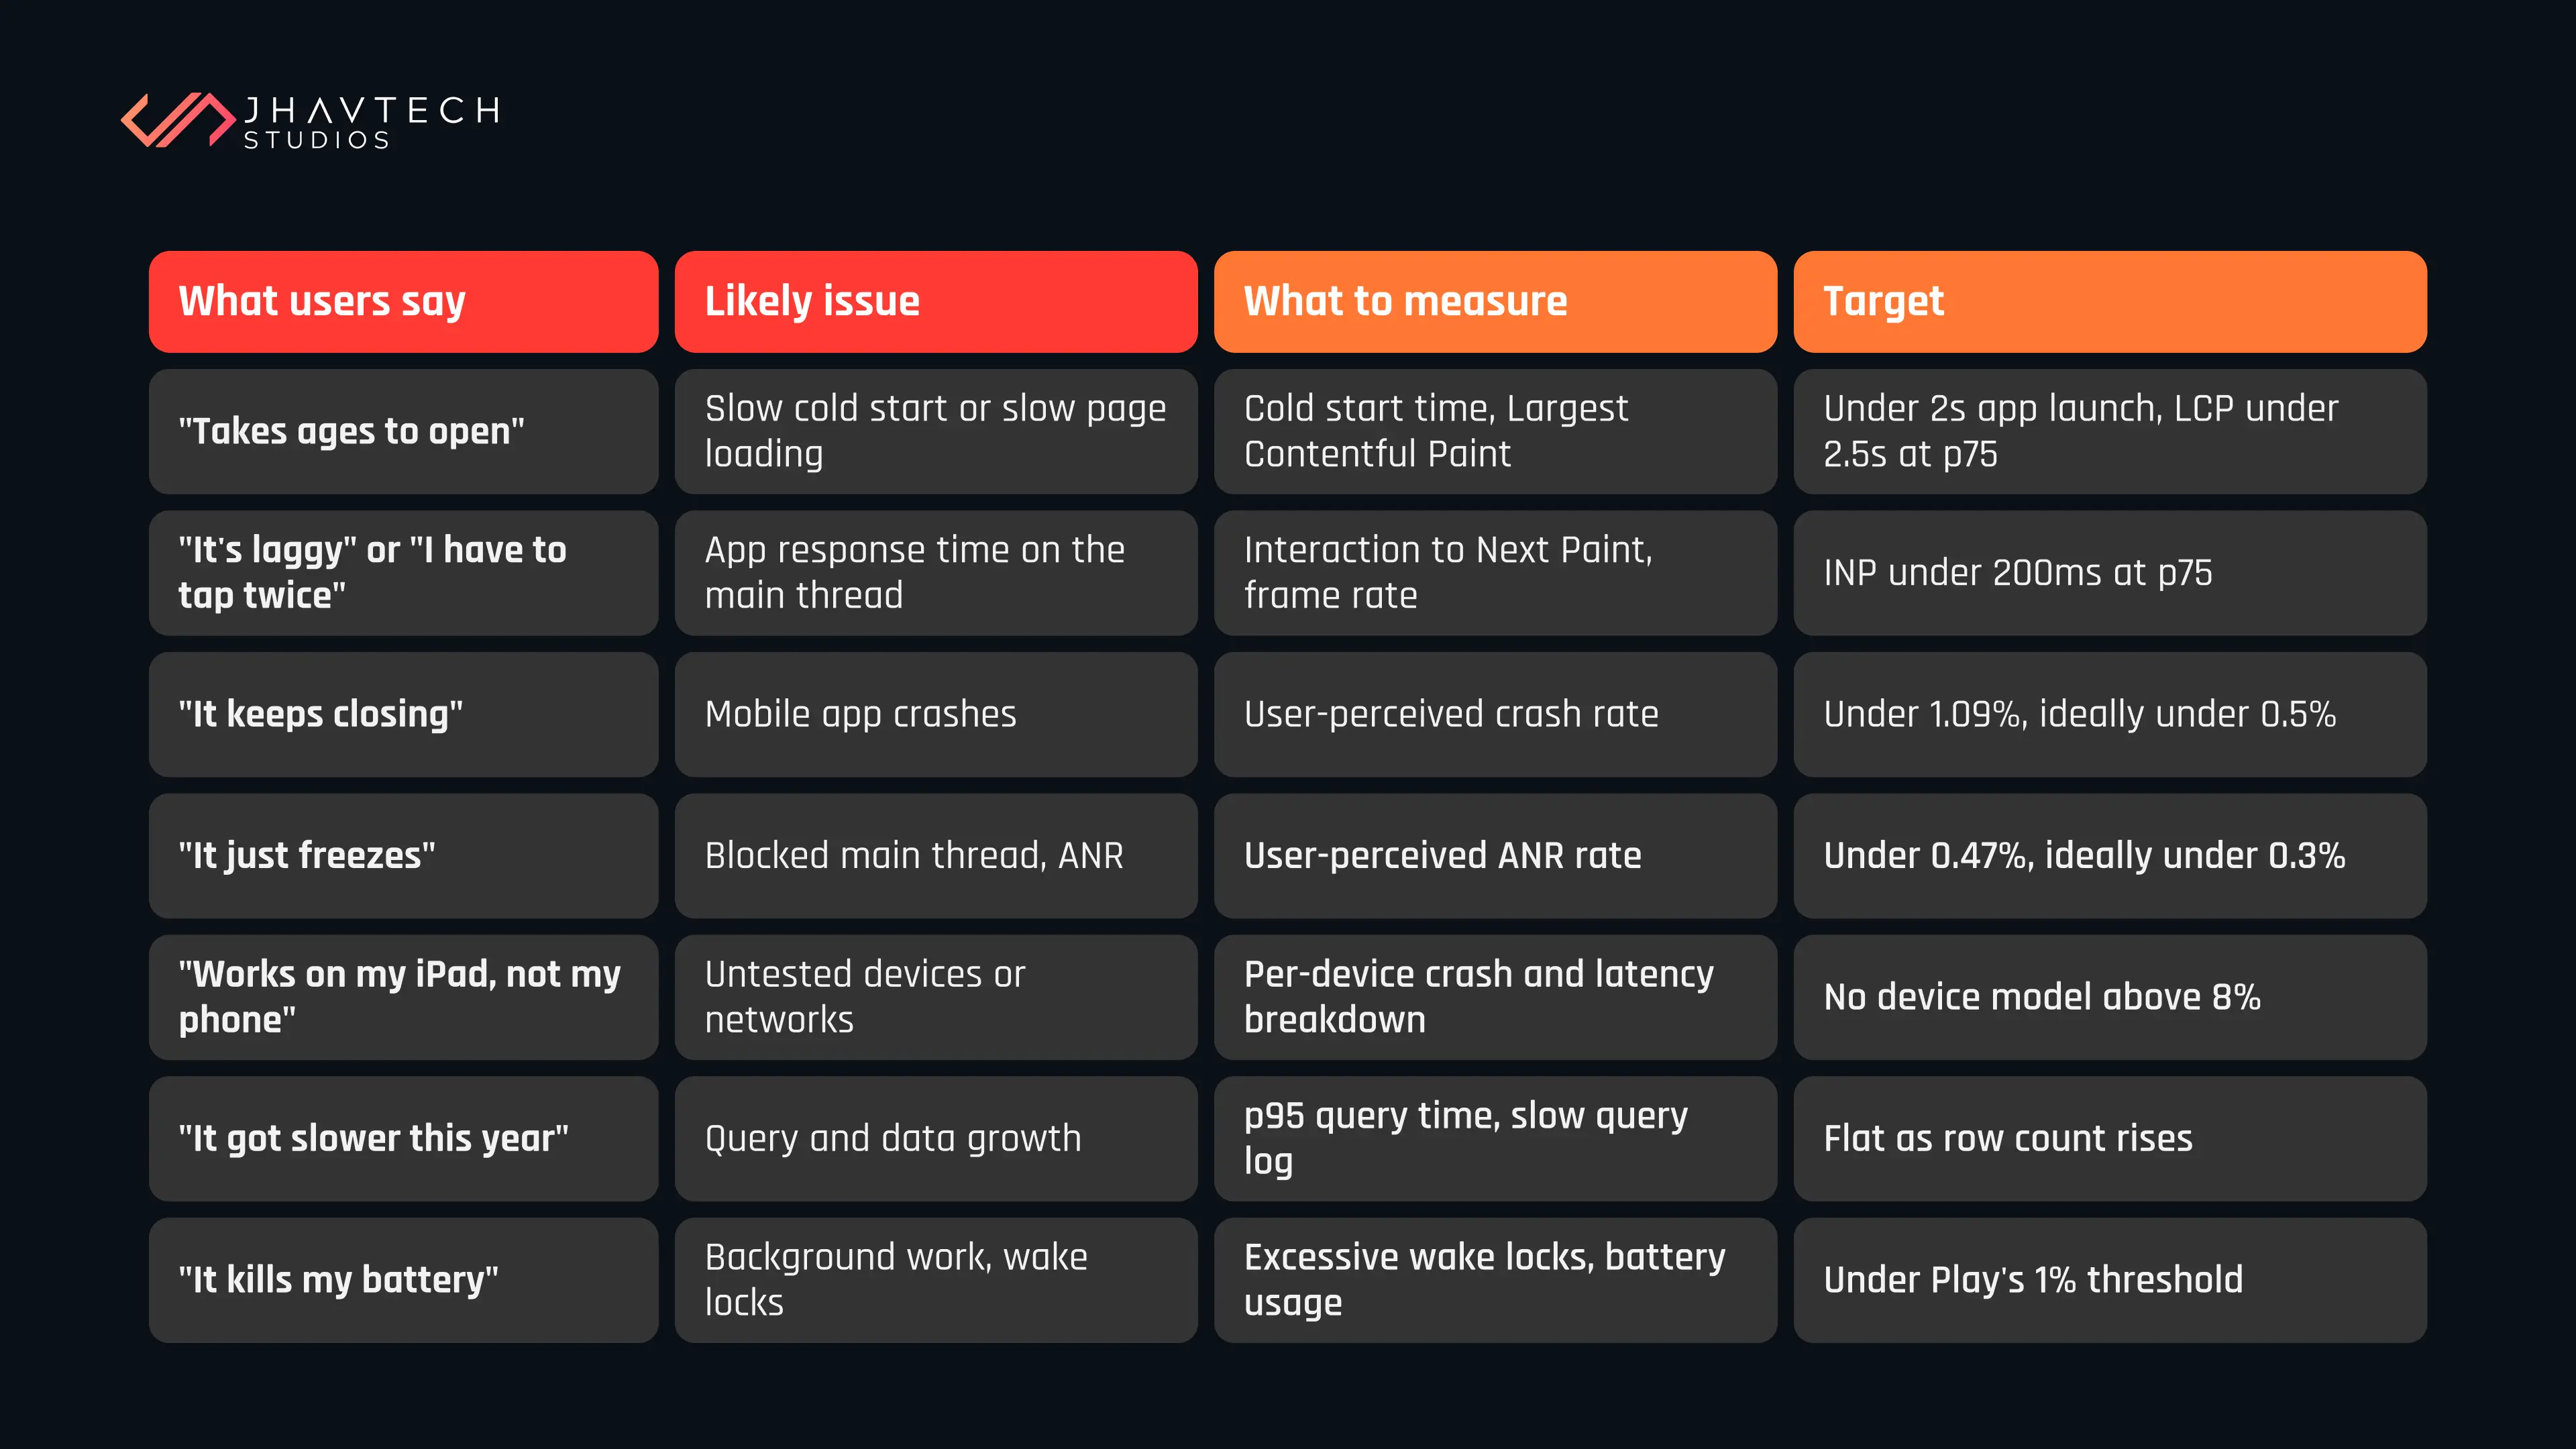
User feedback is vague by nature. This table translates what people say into what to measure, so your next conversation with your developers starts from a number rather than a mood.
The 10-Point Application Performance Checklist
Tick what is true today. Four or more unticked, and performance is a bigger lever on your growth than your next feature.
❑ You can state your cold start time as a number, measured on a mid-range device
❑ You track p95 and p99, not averages
❑ You know your user-perceived crash and ANR rates from Play Console, not just crash-free sessions
❑ Someone opens every release on a cheap Android phone before it ships
❑ Your main user flow has been tested on a throttled connection in the past month
❑ Slow query logs are reviewed by a person, not just collected
❑ Your heaviest list screens are paginated and tested at production data volume
❑ Images are sized and compressed for the device requesting them
❑ Real-user monitoring alerts you before a customer does
❑ A performance regression blocks a release the way a failing test does
Where to Start When Several of These Apply
Most apps have four or five of the seven. Trying to fix all of them at once is how performance work stalls, so sequence it.
Measure before you touch anything. A week of real-user data costs you almost nothing and tells you which of the seven you have. Teams that skip this step optimise the thing that was easiest to find rather than the thing that was costing them users.
Fix stability first. Crashes and freezes outrank speed, because they affect your store visibility as well as your retention. A slow app can be tolerated. An app that dies cannot.
Then fix the path to money. Checkout, booking, signup, whatever your conversion event is. Google's research with Deloitte Digital, covering 30 million sessions across 37 brands, found that a 0.1 second improvement in mobile site speed lifted retail conversion rates by 8.4% and average order value by 9.2% (web.dev). A tenth of a second. Whatever your current delay is costing, it is more than the fix.
Then everything else. Battery, install size, the admin screen three people use.
If what you find is structural rather than a tuning job, there are two sensible paths. Build the next version on foundations designed for the load you are heading towards, or, when the app is live and buckling and you cannot take it down to fix it, bring in a team that stabilises software under real traffic.
Performance issues and design issues also get confused constantly, because both show up as users leaving without explanation. A screen can be fast and still confusing. We unpacked that side of it in how poor UX design quietly kills mobile apps. The diagnosis matters, because the two problems have completely different fixes and a redesign will not rescue a four second cold start.
Frequently Asked Questions