.svg)
.svg)
Understanding and Measuring Mobile App KPIs for Success in 2025
.png)
In 2025, mobile applications are essential business tools. To gauge their impact, mobile app KPIs (Key Performance Indicators) allow businesses to track app success similarly to traditional business metrics such as revenue and customer satisfaction. Mobile app KPIs provide critical insights, showing how well an app is performing from both marketing and technical standpoints. They highlight areas of strength and those requiring improvement, ultimately guiding development teams toward higher engagement, retention, and profitability.
Even if cost-efficiency is a priority, leveraging mobile app KPIs is crucial for maximising long-term value and future growth. Integrating mobile app KPIs from the development phase makes it possible to design, build, and iterate more effectively, aligning features with users' needs and business goals.
Mobile app KPIs may seem like web analytics at first glance, but mobile analytics require more specialised metrics. Since mobile devices vary in performance, operating system, and network connectivity, tracking mobile app KPIs ensures you deliver the best experience possible for your target audience. In this guide, we’ll discuss the critical mobile app KPIs every business should track, organised into three main categories:
- Performance and User Experience (UX) Metrics
- Engagement Metrics
- Sales and Revenue Metrics
Each category plays a unique role in helping your app achieve and sustain success in 2025.
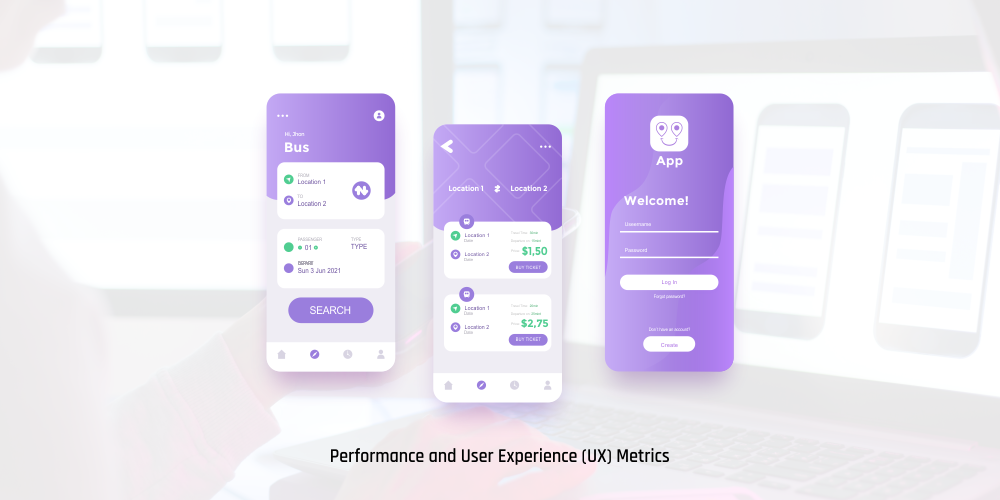
Performance and User Experience (UX) Metrics
User experience has become a crucial competitive edge for mobile apps in 2025, with 88% of users unlikely to return after a bad experience, according to a recent study by AppDynamics. In the realm of mobile app development, ensuring that UX metrics are closely monitored helps avoid pitfalls and guarantees a smoother user journey. These metrics allow you to pinpoint the technical aspects that matter to users, helping create a seamless, frustration-free experience.
Devices and Operating Systems (OS)
Understanding the devices and operating systems most frequently used by your audience is fundamental. As of 2025, approximately 72% of mobile users globally use Android, while iOS holds around 27% of the market, according to Statista. Knowing whether your users prefer Android or iOS helps tailor app functionalities to their expectations.
Further, analysing device specifics, like screen sizes and hardware capabilities, allows you to optimise features accordingly. For example, if a large segment of users is on older devices, prioritising lightweight features can improve performance and user satisfaction, leading to higher retention rates.
Load Time/Speed
Mobile users in 2025 expect apps to load in under two seconds. A study by Google found that a 1-second delay in mobile load times can impact conversion rates by up to 20%. Keeping load time minimal improves the user journey significantly and encourages frequent usage. Performance testing tools, such as Firebase Performance Monitoring, can assist in pinpointing slow areas, letting you improve responsiveness across various devices and networks.
Crash Reports
Crashes are among the top reasons users abandon apps. By tracking crash rates and generating crash reports, you can assess which features may be causing malfunctions. Crashes affect about 60% of users' app perceptions, with many users likely to delete the app after experiencing one crash, according to Dimensional Research. Consistently monitoring crash rates helps you diagnose and fix issues quickly, reducing churn and protecting your reputation.
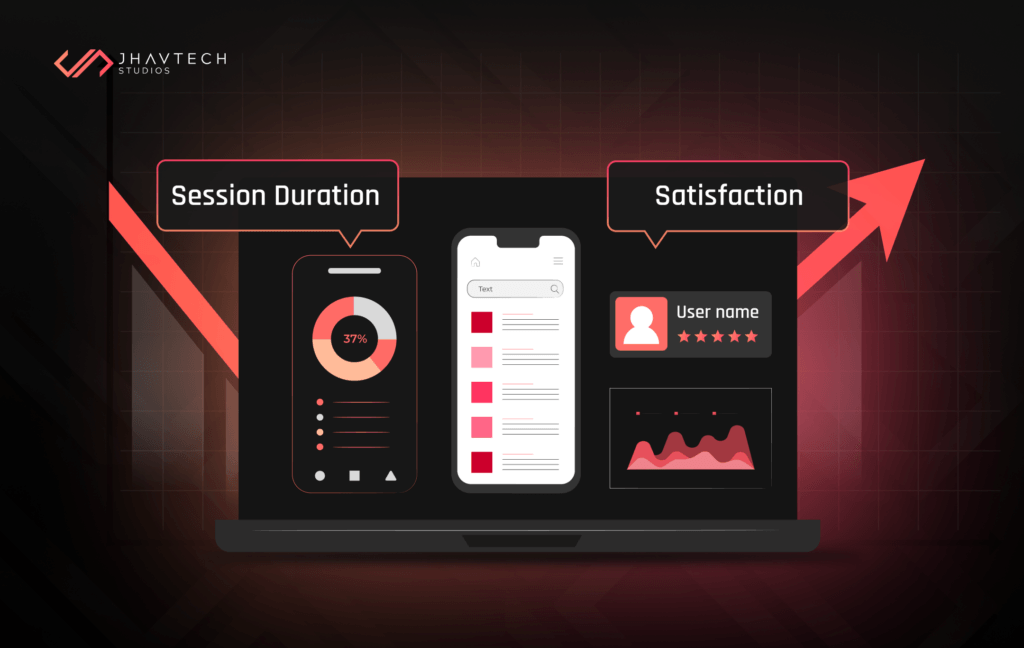
Engagement Metrics
User engagement reveals the depth of connection your audience has with your app. The longer users interact with your app, the greater their potential for conversion and retention. With an estimated 32.4 billion downloads worldwide, competition is fierce, so keeping track of engagement metrics is essential.
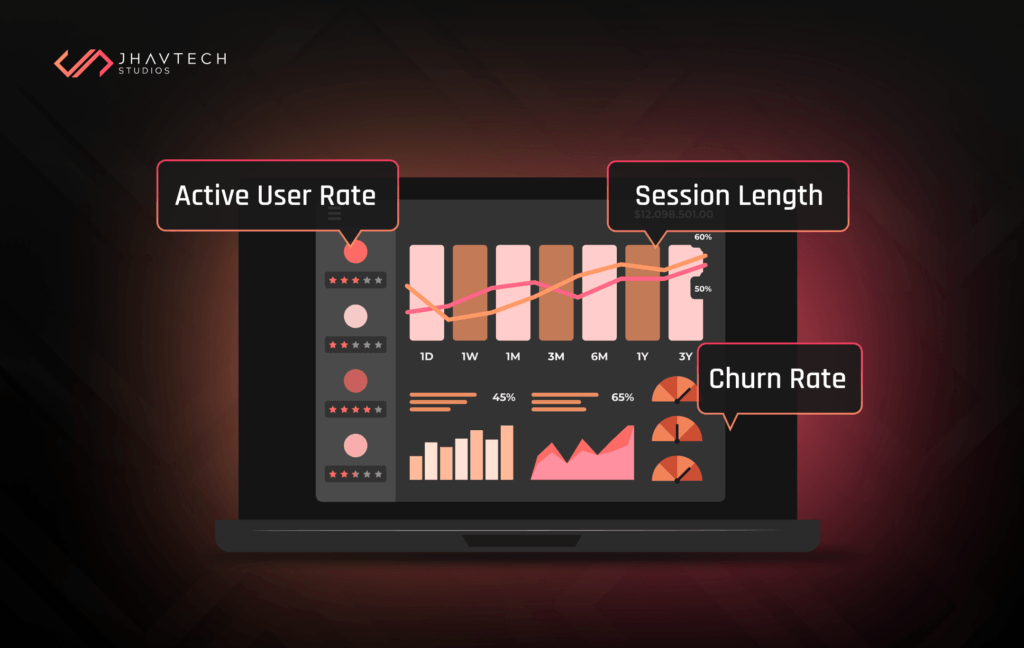
Beyond measuring session length and frequency, tracking metrics such as active user rate, stickiness ratio, and user churn provide a comprehensive view of user engagement trends. These insights are especially valuable for fine-tuning features and content to match user preferences and encourage repeat visits.
By identifying which elements resonate most with engaged users, businesses can foster loyalty, increase retention, and even drive virality. High engagement levels signal to new users that the app offers real value, setting it apart in a crowded marketplace and creating a strong foundation for growth.
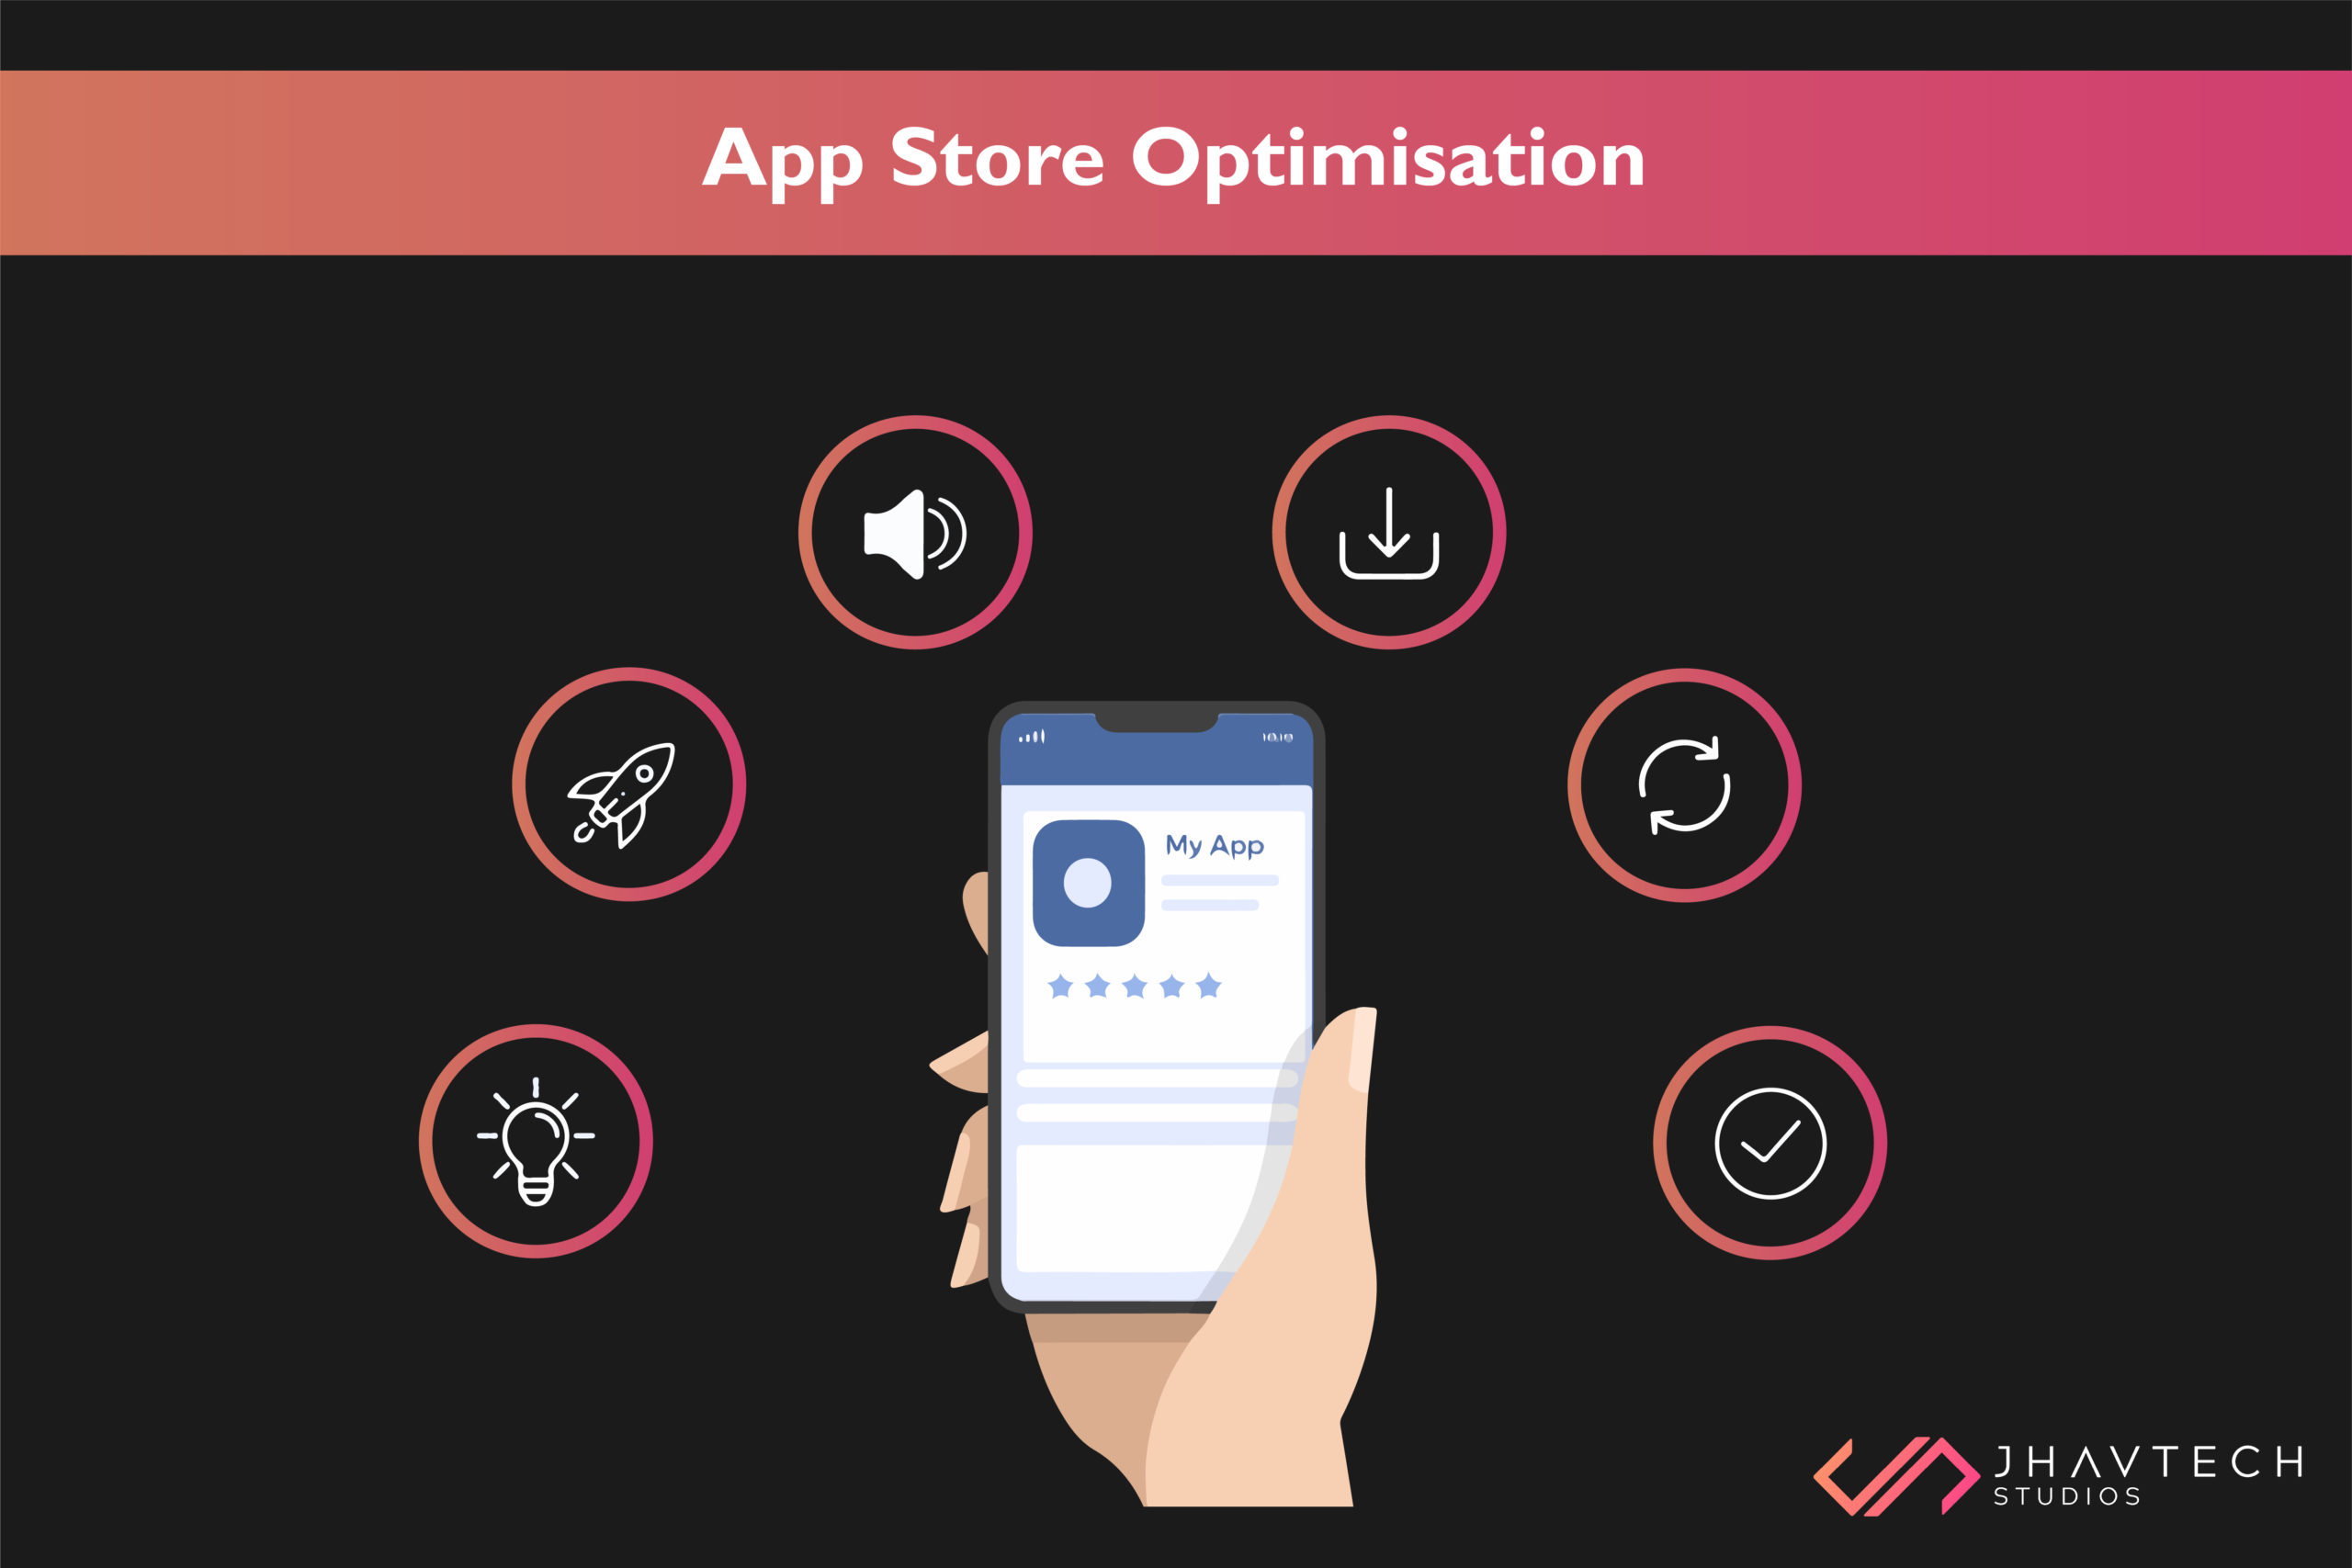
Number of Downloads
Download numbers often reflect the initial success of an app. However, it’s vital to examine where users are discovering your app. As of 2025, over 50% of app downloads come from app store recommendations, highlighting the importance of app store optimisation. Using tracking tools like Adjust or App Annie helps understand the effectiveness of various marketing channels and optimise promotional efforts to increase downloads from targeted demographics.
Session Length
The average session length for mobile apps has increased to about 6.3 minutes, according to data from Localytics. Longer session lengths indicate that users find the app valuable and engaging. By tracking session duration, you can analyse the features that keep users active, helping you refine your product to increase these engagements.
Retention Rate
Retention rate measures the percentage of users who continue to use the app over a set period, usually 30 days. This metric offers insights into user loyalty and helps identify patterns in user behavior that promote long-term engagement. Apps with strong retention rates—generally around 40% after 30 days—are more likely to develop a sustainable user base. Conducting A/B tests on app features is a good practice to see what works for enhancing user retention.
Churn Rate
Churn rate reflects the percentage of users who uninstall or abandon the app after using it a few times. High churn rates can indicate a lack of new content, bugs, or suboptimal UX. Reducing churn by even a small percentage can greatly improve user retention. In 2025, the industry standard monthly churn rate for mobile apps is about 8% across Android and iOS, so targeting lower than this benchmark is ideal.
Sales and Revenue Metrics
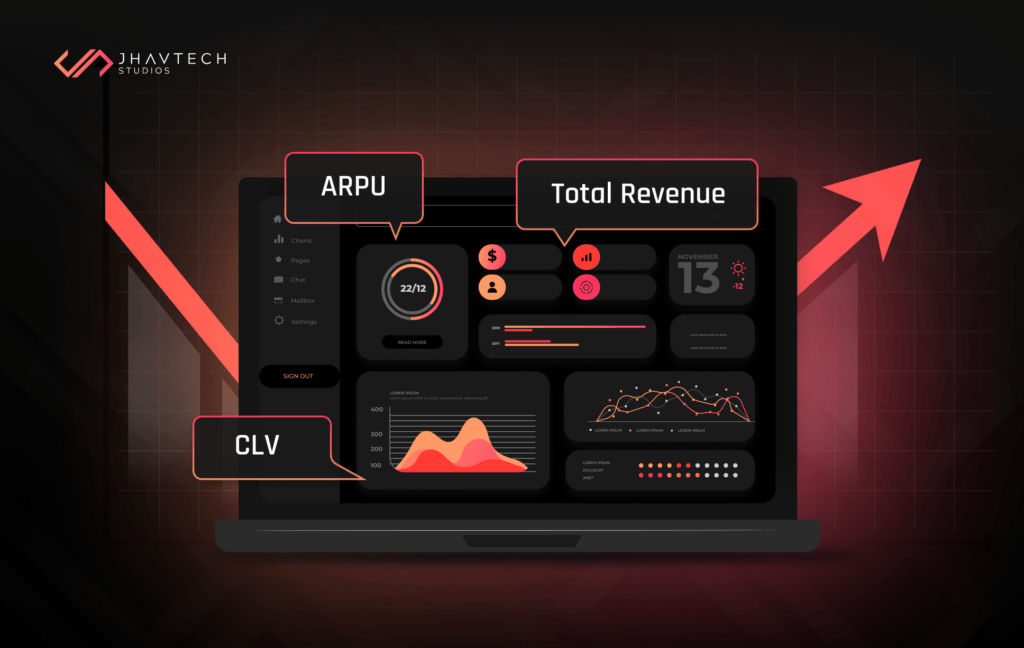
Revenue-related mobile app KPIs reflect the financial impact of your app on the business. Monetisation strategies in 2025 range from in-app purchases to subscriptions, making it essential to track revenue generation at every user interaction level.
Beyond tracking direct revenue, analyzing metrics such as average revenue per user (ARPU) and customer lifetime value (CLV) offers deeper insights into each user’s contribution to the app's profitability. For viral apps, which often gain a rapid influx of users through social sharing and word-of-mouth, understanding which features drive spending can be especially valuable.
By combining revenue metrics with engagement data, businesses can refine user segmentation and create targeted strategies to maximise earnings across different user groups. This approach not only optimises monetisation but also ensures that app updates and new features align with high-revenue user behaviors, supporting sustained financial growth.
Average Revenue Per User (ARPU)
ARPU is calculated by dividing the total revenue by the number of active users. It gives insight into the average spending of each user, providing an indicator of the app’s profitability. For example, in 2025, many apps rely on hybrid revenue models, combining subscriptions with ad revenue. This helps diversify income streams and optimise monetisation, especially for apps with a high volume of active users.
Lifetime Value (LTV)
LTV represents the total revenue generated by a user during their entire time using the app. With acquisition costs continuing to rise, apps in 2025 aim for an LTV of at least three times the customer acquisition cost. By improving LTV, businesses can maximise their return on investment and concentrate on features that drive customer loyalty and recurring revenue.
Conversion Rate
Conversion rate, or the percentage of users who complete a desired action (such as purchasing a subscription or in-app item), is one of the most critical mobile app KPIs for revenue growth. The conversion rate can be enhanced through targeted push notifications and personalised offers. Research from Iterable in 2024 found that personalised push notifications increase conversion rates by 18% on average, emphasising the importance of customisation in boosting sales.
Time to First Purchase
This KPI tracks the duration between when a user downloads the app and when they make their first purchase. Apps that successfully reduce the time to the first purchase often employ user onboarding flows that introduce the app's value quickly and efficiently. For instance, a popular mobile game might introduce special discounts during a user’s first 24 hours, increasing the likelihood of immediate purchases.
Cost Per Install (CPI)
CPI measures the expense involved in acquiring new users via paid campaigns. In 2025, CPI has risen to approximately $1.20 for Android and $0.90 for iOS, as mobile ad competition intensifies. Tracking CPI allows businesses to optimise their ad spend, improving targeting to acquire high-quality users without overspending.
Wrapping Up: Choosing and Monitoring Mobile App KPIs in 2025
In 2025, understanding and optimising mobile app KPIs are crucial for businesses aiming to improve user experience, engagement, and revenue. As users become more selective with app choices, standing out requires an acute understanding of user behavior and strategic optimisation based on app performance metrics.
By tracking KPIs such as load time, session length, retention rate, LTV, and conversion rate, app developers and marketers can create data-driven strategies to improve app performance and appeal to their target audience. Mobile app KPIs guide actionable insights, helping you adapt to evolving user expectations and technological advancements.
Whether your app is newly launched or well-established, refining your mobile app KPIs will keep it competitive in a crowded market. And if you’re ready to learn more about optimising mobile app KPIs or building an app that maximises engagement a
.png)
.png)
.png)
.png)

.png)

.png)
.png)
.png)
.png)
.png)
.png)


.png)
.png)

.png)
.png)
.png)
.png)

.png)
.png)


.png)
.png)
.png)

.png)


.png)


.png)


.png)


.png)


.png)


.png)
.png)

.png)


.png)
.png)

.png)


.png)
.png)


.png)
.png)
.png)

.png)