How Can Businesses Measure the Business Value of IT Investments?
Summary: What You Need to Know
Most IT investment value goes unmeasured because nobody recorded the “before”. Without a baseline captured in the month before go-live, any claim about improvement afterwards is a story, not a number.
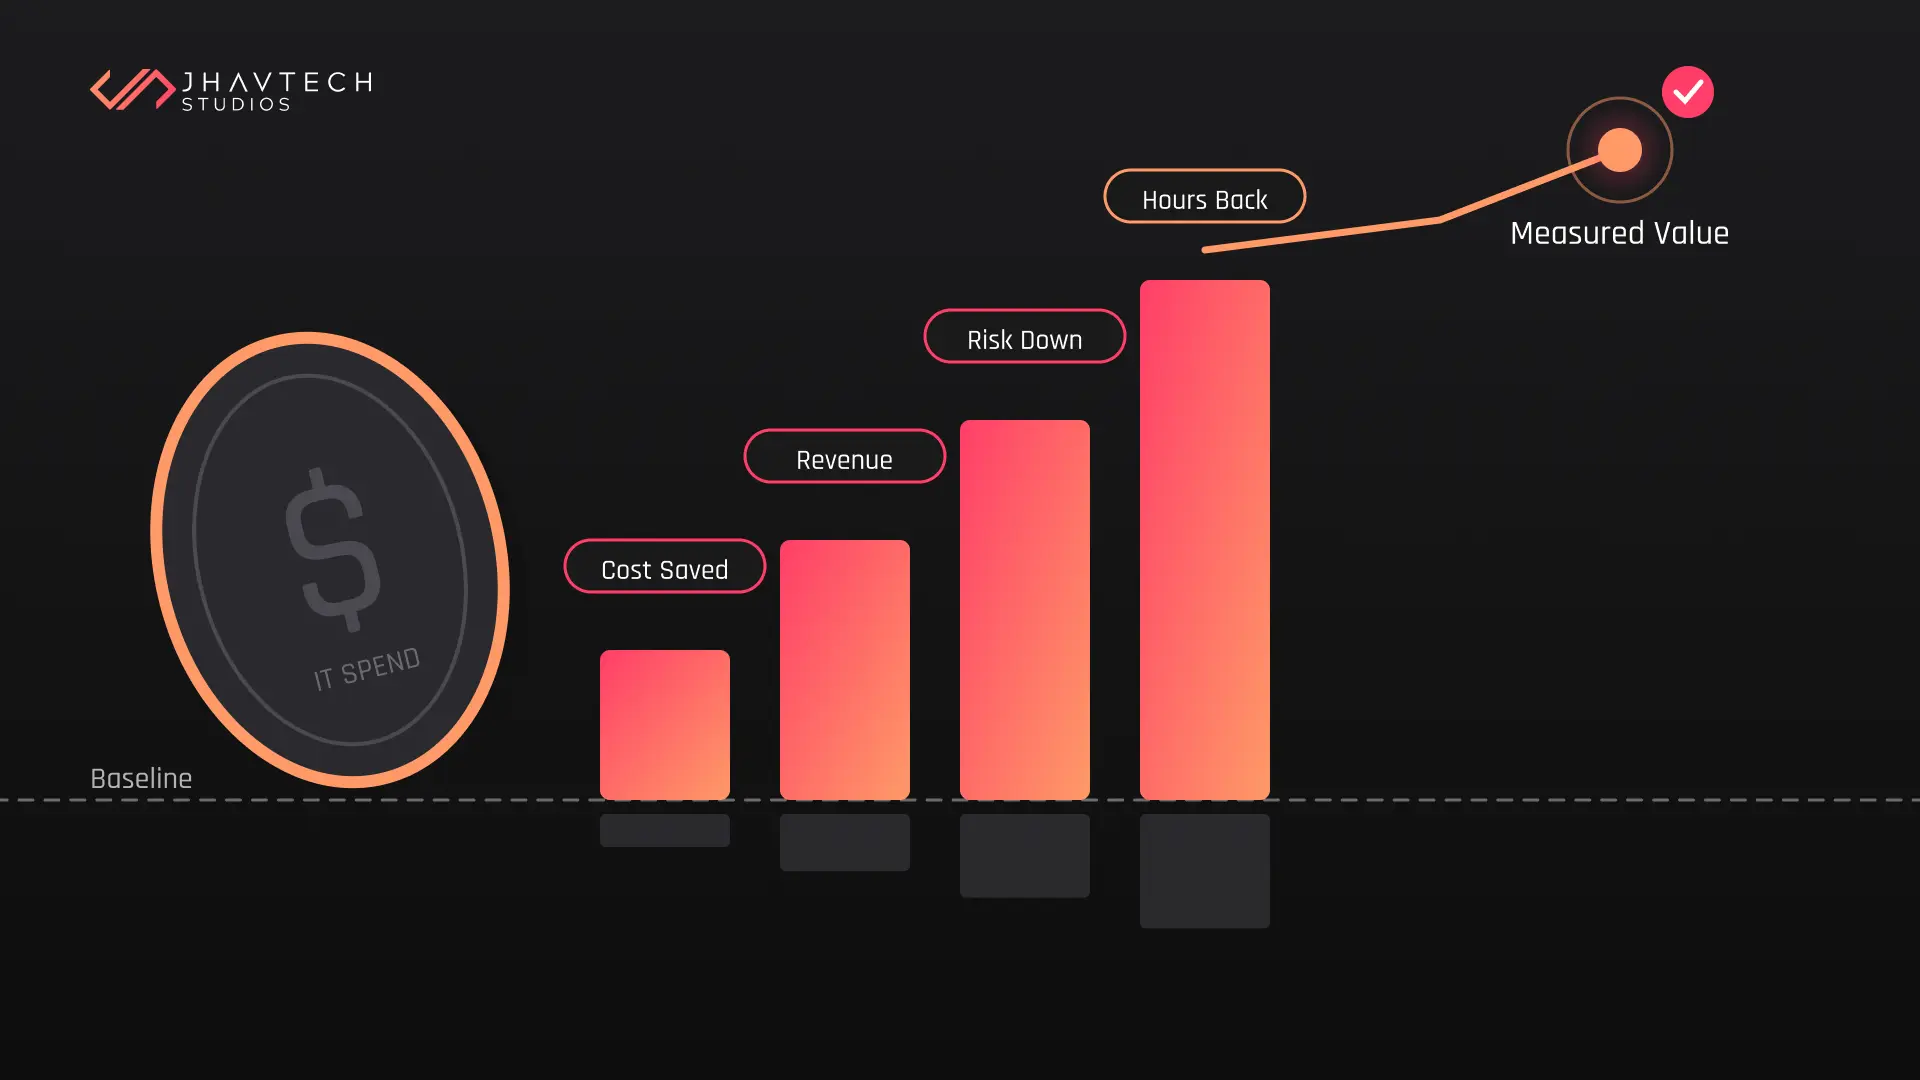
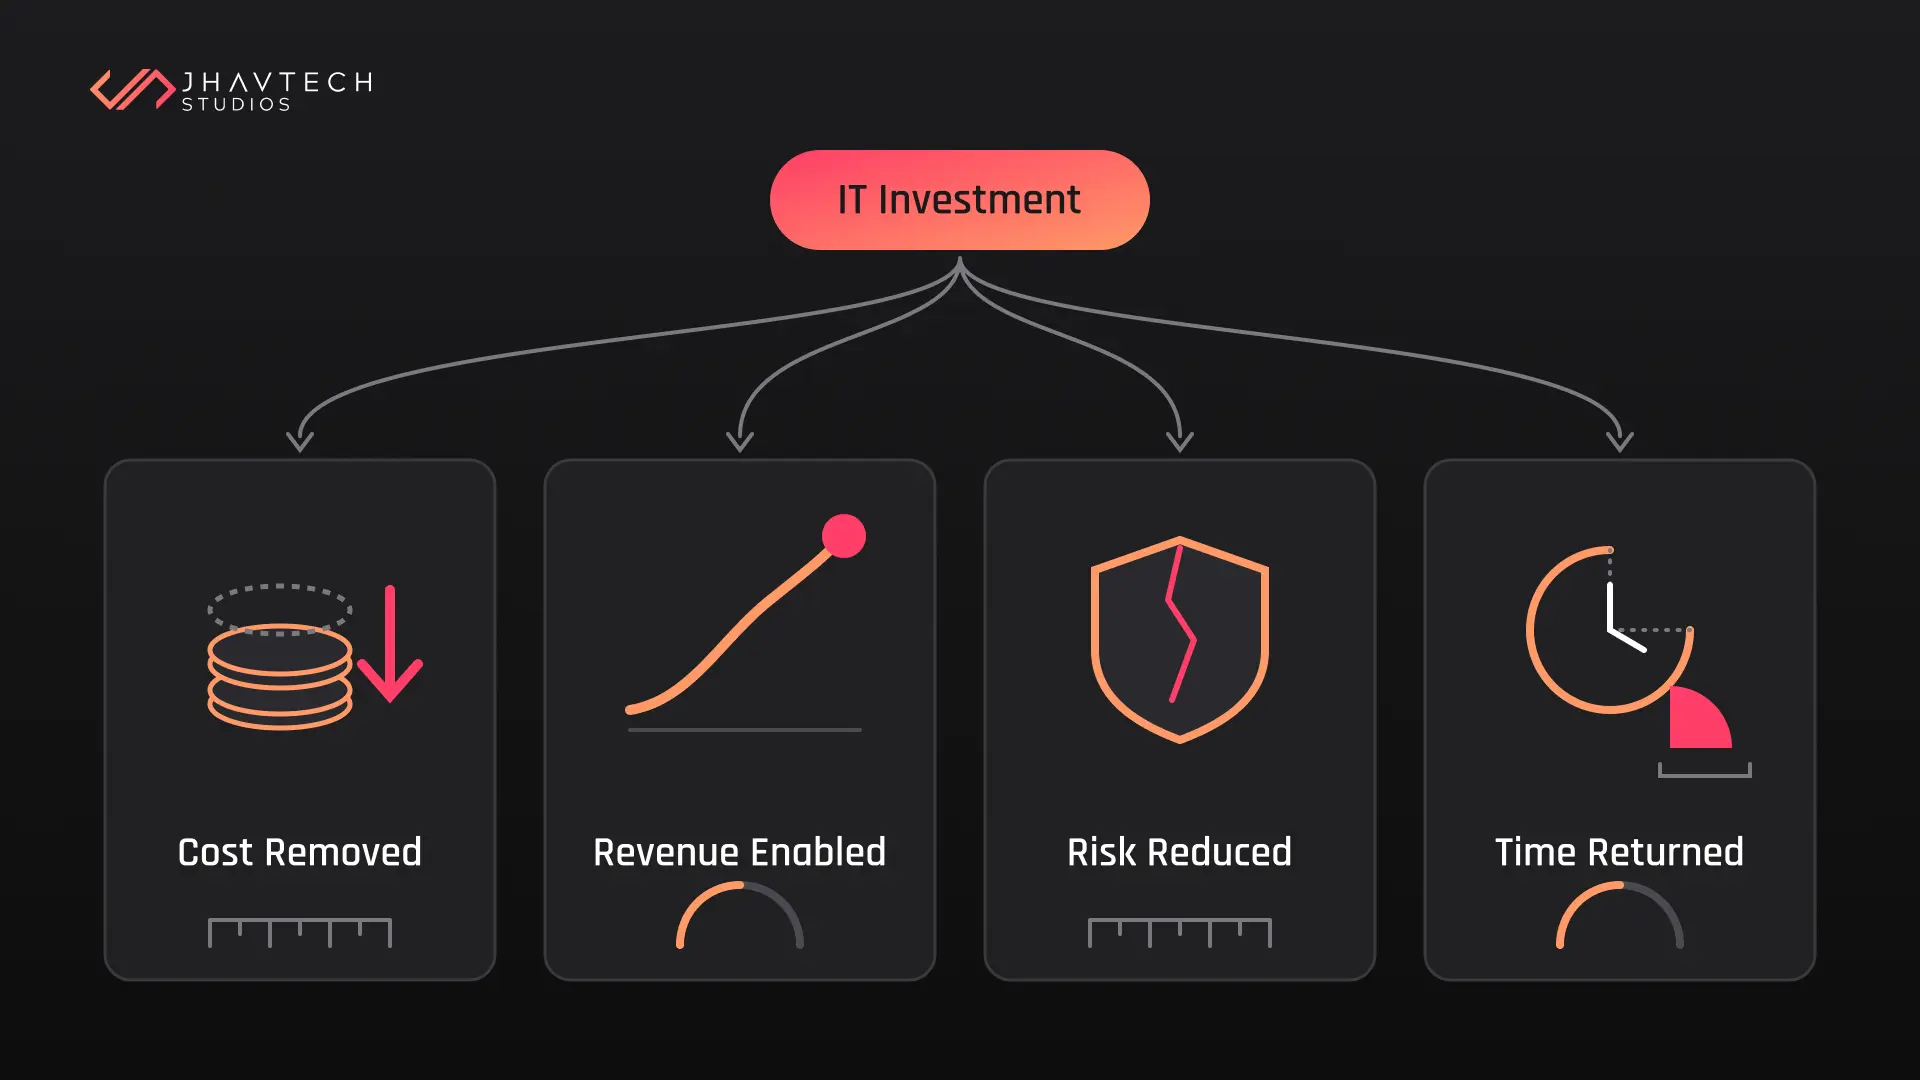
Value shows up in four places: cost removed, revenue enabled, risk reduced, and time given back to people. Each needs a different measure, and mixing them produces a figure nobody believes.
McKinsey’s 2026 global survey of 1,719 leaders across 97 countries found 80% report personal productivity gains from AI, while only 37% can attribute any EBIT impact to it. Individual benefit and company value are not the same thing.
Gartner forecasts worldwide IT spending of US$6.37 trillion in 2026, up 14.2% on 2025. Budgets are growing faster than the discipline of proving they worked.
The table, worked example and checklist below give you a measurement method you can run without a finance team.
A Melbourne logistics firm we worked with had spent about $140,000 across two years on a job management platform. When their board asked what it had returned, the operations manager produced a slide with the words “significant efficiency gains” on it. Nobody in the room could challenge that, and nobody believed it either.
Six weeks later, they had a real answer. Quote turnaround had dropped from four days to one. Invoice disputes fell by roughly 60%. Two admin roles had shifted to client work rather than being cut. The platform had paid for itself in year two. The number existed the whole time. It just had nobody assigned to find it.
That gap is the normal state of affairs. Gartner expects global IT spending to reach US$6.37 trillion in 2026, a 14.2% rise on the previous year (Gartner, July 2026). Spending is rising. The ability to prove what that spending did is not keeping pace.
Why Most IT Investment Value Never Gets Measured
There are three reasons, and they repeat across almost every business we audit.
The first is timing. Measurement gets discussed after launch, when the system has already changed how work happens, and the old numbers are gone. You cannot reconstruct a baseline from memory.
The second is ownership. The project manager leaves when the project ships. The budget holder moved on to the next thing. The question of whether it worked belongs to nobody, so it is never asked.
The third is honesty, which is the uncomfortable one. A review that might say “this did not pay off” is a review some people would rather not schedule.
McKinsey’s 2026 State of AI survey makes the scale of this visible. Across 1,719 respondents in 97 countries, 80% said AI had improved their own productivity, while only 37% could attribute any EBIT impact to it at the organisational level, flat on the previous year (McKinsey, August 2026). People genuinely feel faster. The company accounts have not noticed. Both can be true at once, and the gap between them is usually a measurement problem layered on top of a process problem.
The Four Places IT Investment Value Shows Up
Lumping everything into one ROI percentage hides more than it reveals. Split it.
- Cost removed. Licences cancelled, hours no longer worked, third-party fees avoided, and infrastructure switched off. This is the easiest category to evidence and the one most businesses understate, because the savings sit across four different cost centres.
- Revenue enabled. More quotes out the door, higher conversion, faster onboarding, a new channel that did not exist before. Harder to attribute cleanly, which is why you record the conversion rate before you change anything.
- Risk reduced. Compliance exposure, downtime, data loss, key-person dependency. Value here is a cost you did not pay. The ABS found 28% of Australian businesses had no measures at all in place to prevent cyber security incidents in 2024–25 (ABS, Characteristics of Australian Business). For those businesses, a security improvement carries real value that will never appear on a P&L.
- Time returned. Hours freed from repetitive work. This only becomes value when the freed hours go somewhere specific. Twenty hours a week released into “general capacity” is a rounding error. Twenty hours redirected into sales follow-up is a number.
Build the Baseline Before You Spend a Dollar
This is the single step that separates businesses with defensible numbers from businesses with slide decks.
Pick two or three measures your investment is meant to move. Not ten. Measure them for a full cycle before go-live, which usually means four weeks for operational work and a quarter for anything with a sales cycle attached.
Write down the current figure, who collected it, and how. “Average time from enquiry to quote: 3.8 days, measured across 112 enquiries in September, pulled from the CRM by Sarah.” That level of specificity takes an afternoon and makes the post-launch comparison impossible to argue with.
If the baseline is awkward to collect, that is information too. A process you cannot measure today is a process you probably should not automate yet. Our walkthrough on putting a dollar figure on the problem before anyone writes code covers how to size the opportunity while it is still cheap to change course.
Technology Performance Metrics That Mean Something
Most dashboards measure the system. Useful measurement tracks what the system changed about the business. The difference matters, because uptime of 99.95% tells your board nothing they can act on.
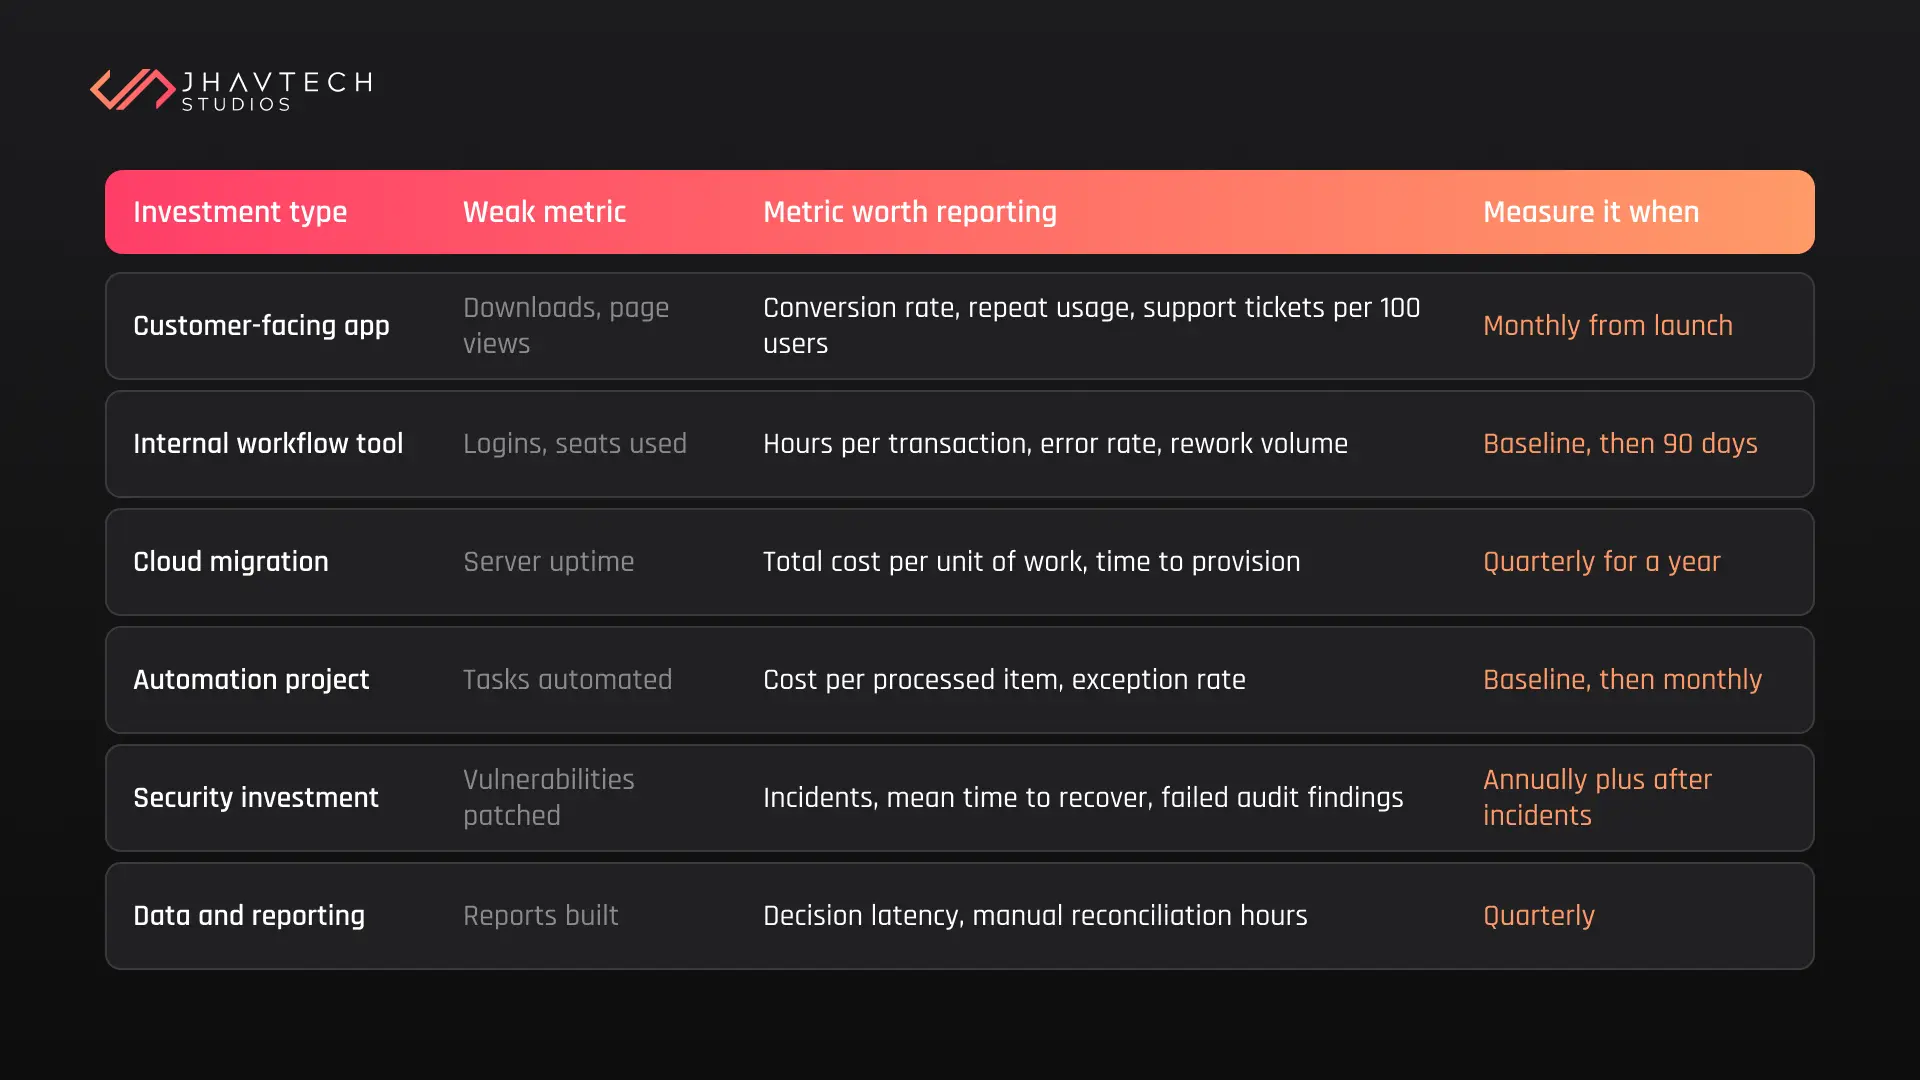
One rule holds across every row. If a metric cannot change a decision, stop reporting it. Exception rate on an automation project tells you whether to expand it or fix the underlying process. The nNumber of tasks automated tells you nothing except that money was spent.
Running an IT Cost-Benefit Analysis Without a Finance Degree
An honest IT cost-benefit analysis has four lines. Most businesses fill in one of them.
- Line one, full cost. Not the quote. The quote, plus internal hours spent on implementation, plus training time, plus the productivity dip in the first eight weeks, plus ongoing licences and support, plus the integration work nobody scoped.
- Line two, quantified benefit. The four value categories above, each with its own number and its own source.
- Line three, timing. When does each benefit start? A cost saving that begins in month nine is worth less than one that begins in month two, and treating them as equal flatters the result.
- Line four, confidence. Mark each benefit high, medium or low confidence. Report the high-confidence total as your headline, with the rest as upside. This is the line that makes finance people trust the whole exercise.
A worked example from a 30-person professional services business. Platform cost $52,000 over two years including internal time. Measured benefits after twelve months: 14 admin hours a week saved at a loaded rate of $45, which is $32,760 a year, marked high confidence because it came from timesheets. Quote turnaround halved, correlating with a 9% lift in win rate, worth roughly $61,000 in gross margin, marked medium confidence because other things changed that year. Two cancelled tools worth $7,200 a year, high confidence.
High-confidence benefit alone covers the full two-year cost inside fifteen months. That is a defensible claim. “Significant efficiency gains” is not.
Measuring Business Process Efficiency After Go-Live
Business process efficiency is where most of the real value sits, and where measurement most often goes soft.
Three things to track, starting ninety days after launch.
Cycle time. How long does one complete unit of work take, start to finish, including the waiting? Waiting is usually where the hours hide.
Touch count. How many people handle one transaction? A quote that passes through four hands before it reaches a client is four chances to stall. Good technology reduces this number. Bad technology adds a step and calls it visibility.
Exception rate. What percentage of transactions fall outside the system and get handled manually? This is the honest measure of whether an investment landed. A platform running at a 30% exception rate is being worked around, whatever the adoption dashboard says.
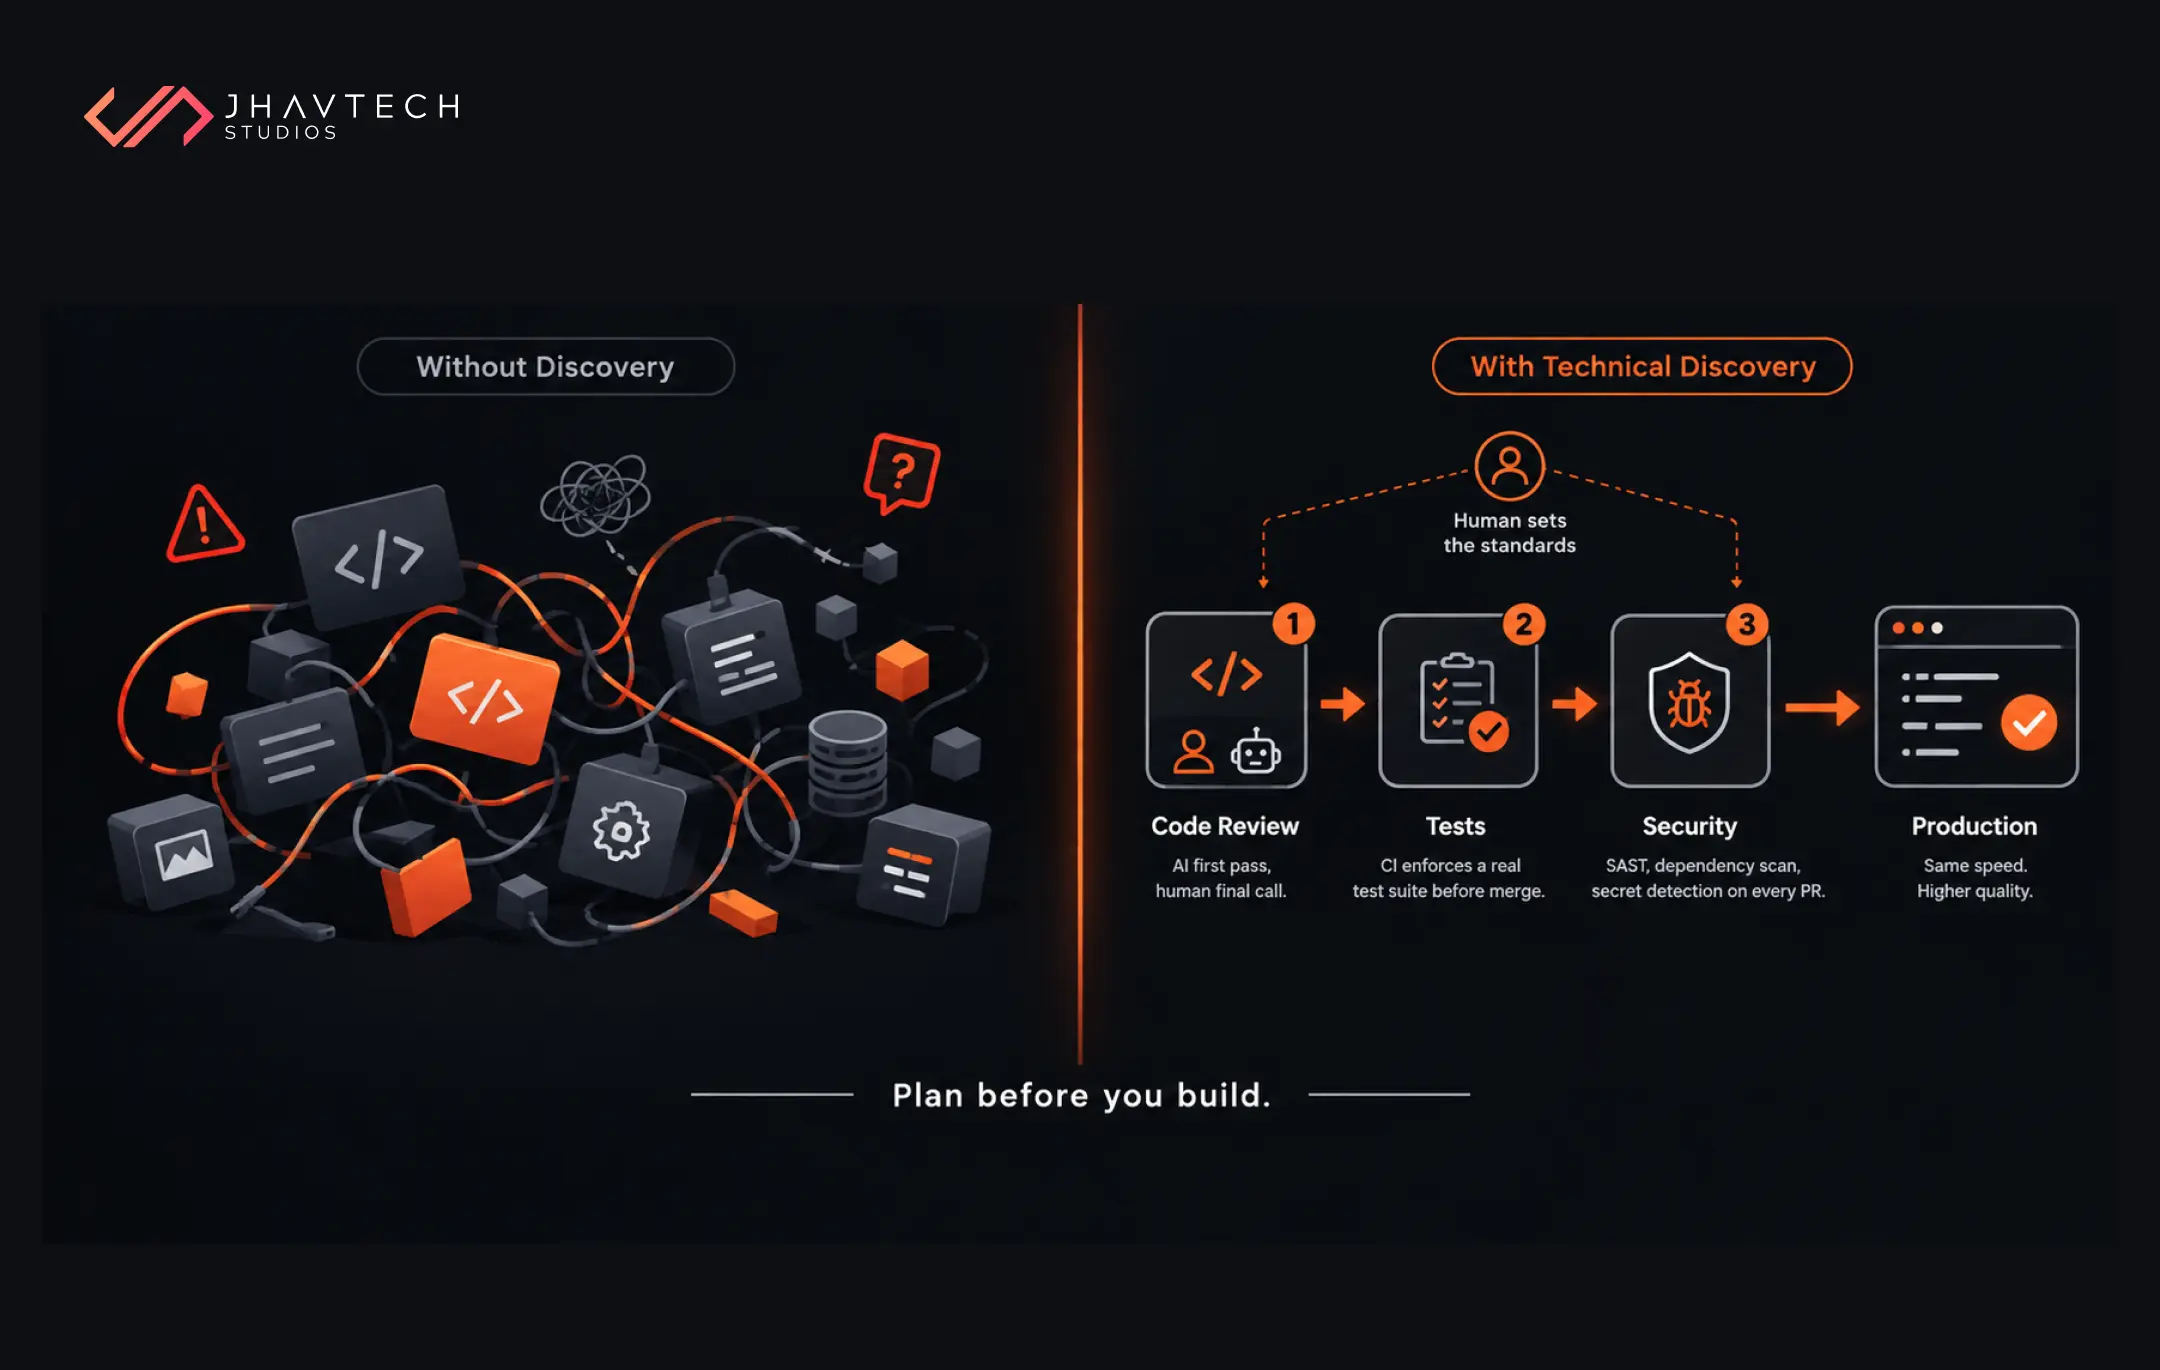
Watch the exception rate closely in the first two quarters. Rising exceptions almost always signal that the process was never fixed before it was automated, and that is a cheaper problem to solve at month three than at month eighteen. We covered the pattern in detail in our piece on why AI projects fail to deliver what businesses expect, and the diagnosis applies well beyond AI.
Digital Transformation ROI Over a Longer Horizon
Single projects are measurable in quarters. Multi-year programmes need a different frame, and they are where value quietly disappears.
BCG’s research across more than 860 companies found only 30% of digital transformations met or exceeded their target value and produced lasting change (BCG). The finding has been stable for years, which suggests the failure is structural rather than situational.
For anything running longer than twelve months, three practices change the odds.
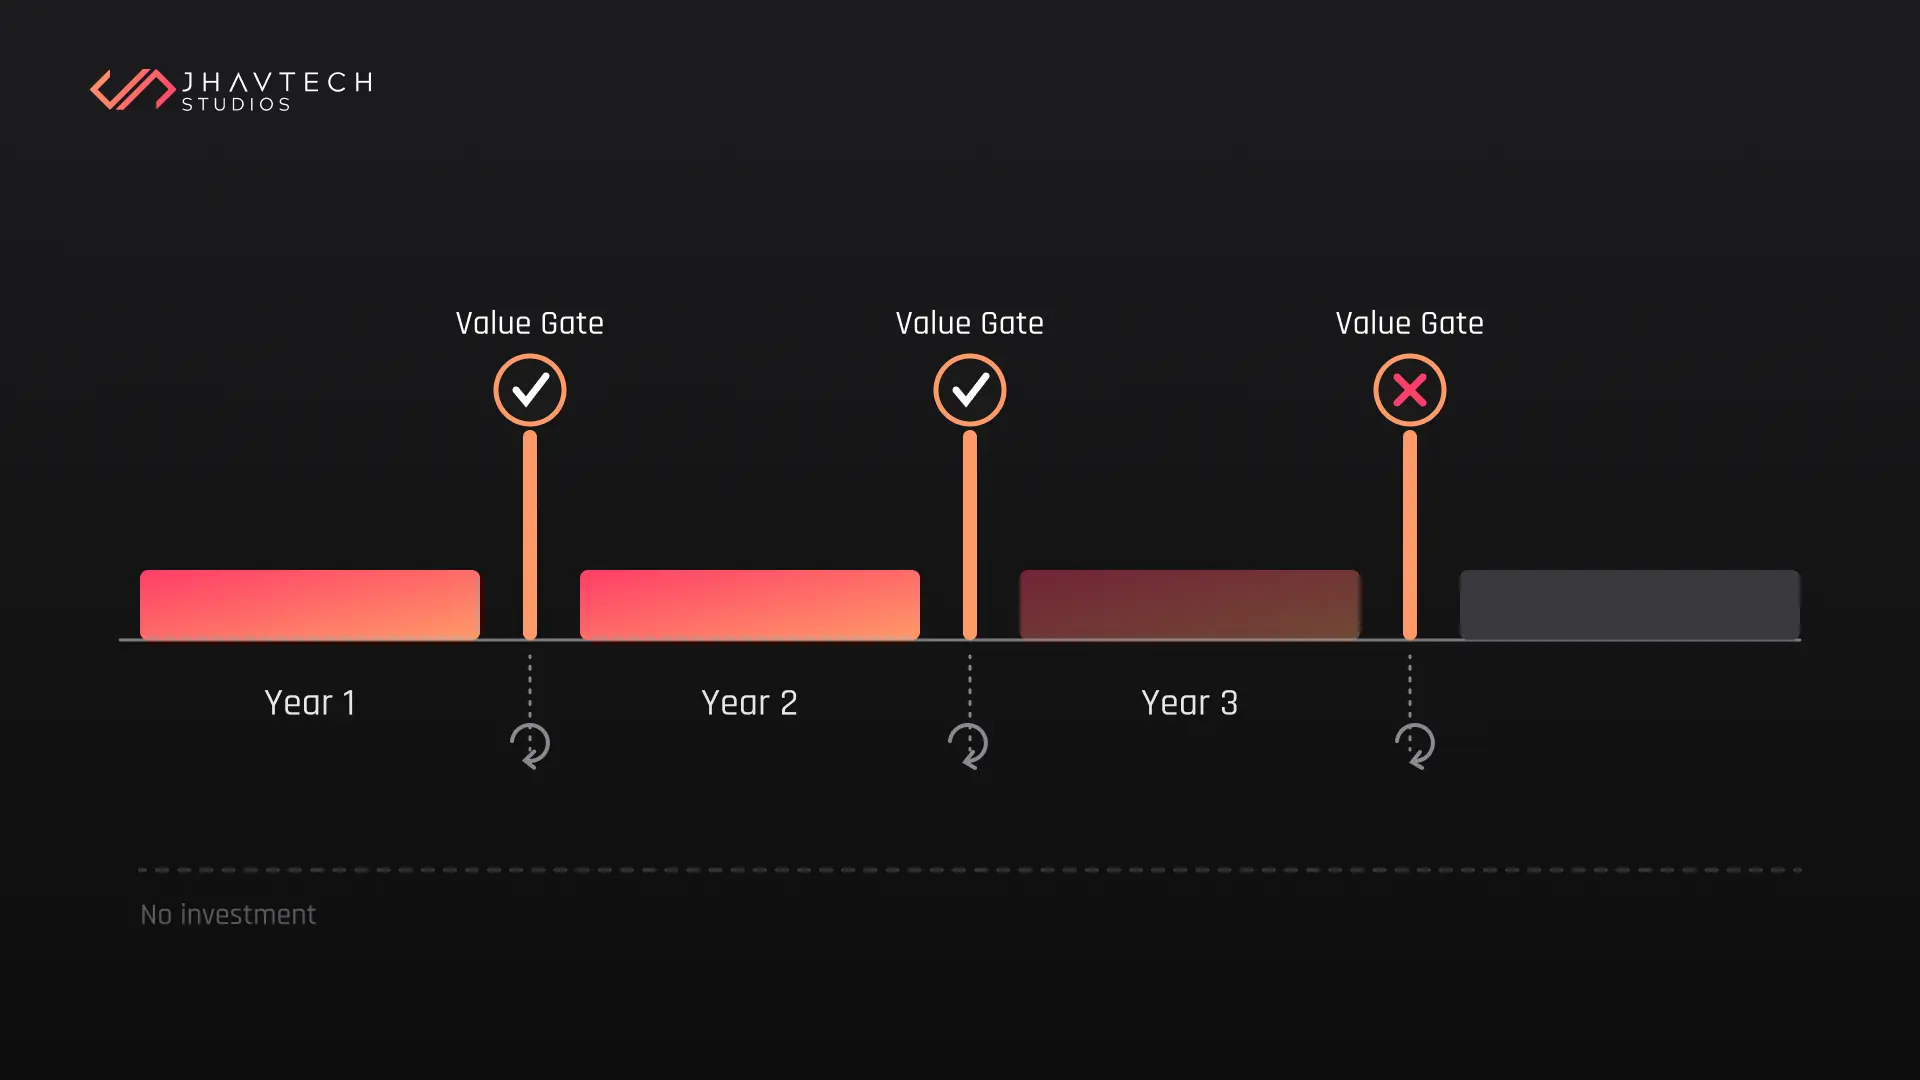
Break the programme into stages with their own value gates. Each stage must demonstrate measured benefit before the next one is funded. This feels slow and saves enormous sums.
Re-baseline every year. The business you measured against in 2024 is not the business you are running now, and comparing against a stale baseline produces numbers that fool everyone including you.
Record the counterfactual. What would have happened with no investment at all? Sometimes the honest answer is that revenue would have grown anyway. Writing that down keeps the analysis credible when someone senior eventually tests it.
When a programme has drifted past the point where measurement helps and the dates keep moving, the fix is not another steering committee. It is bringing in a team that takes over stalled builds and gets them shipping again while the business keeps trading.
The Measurement Checklist
Run this before go-live, then again at ninety days. Four or more unticked and your value claim will not survive scrutiny.
☐ Two or three target measures are named, not ten
☐ Baseline figures are recorded with date, source and collector
☐ Each expected benefit is tagged cost, revenue, risk or time
☐ Full cost includes internal hours and the first-eight-weeks dip
☐ Every benefit carries a confidence rating
☐ A review date sits in the calendar with a person’s name against it
☐ Exception rate is being tracked from month one
☐ Freed hours have a named destination
☐ The counterfactual has been written down
☐ Someone has authority to stop paying if the review fails
A business ticking eight of these knows what its technology is worth. A business ticking three is guessing with confidence.
Where This Leaves You
Measuring IT investment value is not a finance exercise. It is a habit of writing things down before they change, and of being willing to read the result.
The businesses that get the most from technology are rarely the ones spending the most. They are the ones who can tell you, without hedging, what the last three investments returned. That clarity compounds. It makes the next decision faster, the next budget easier to defend, and the next vendor conversation considerably shorter.
If you are about to approve something sizeable, spend the afternoon on the baseline first. It is the cheapest insurance in the whole project.
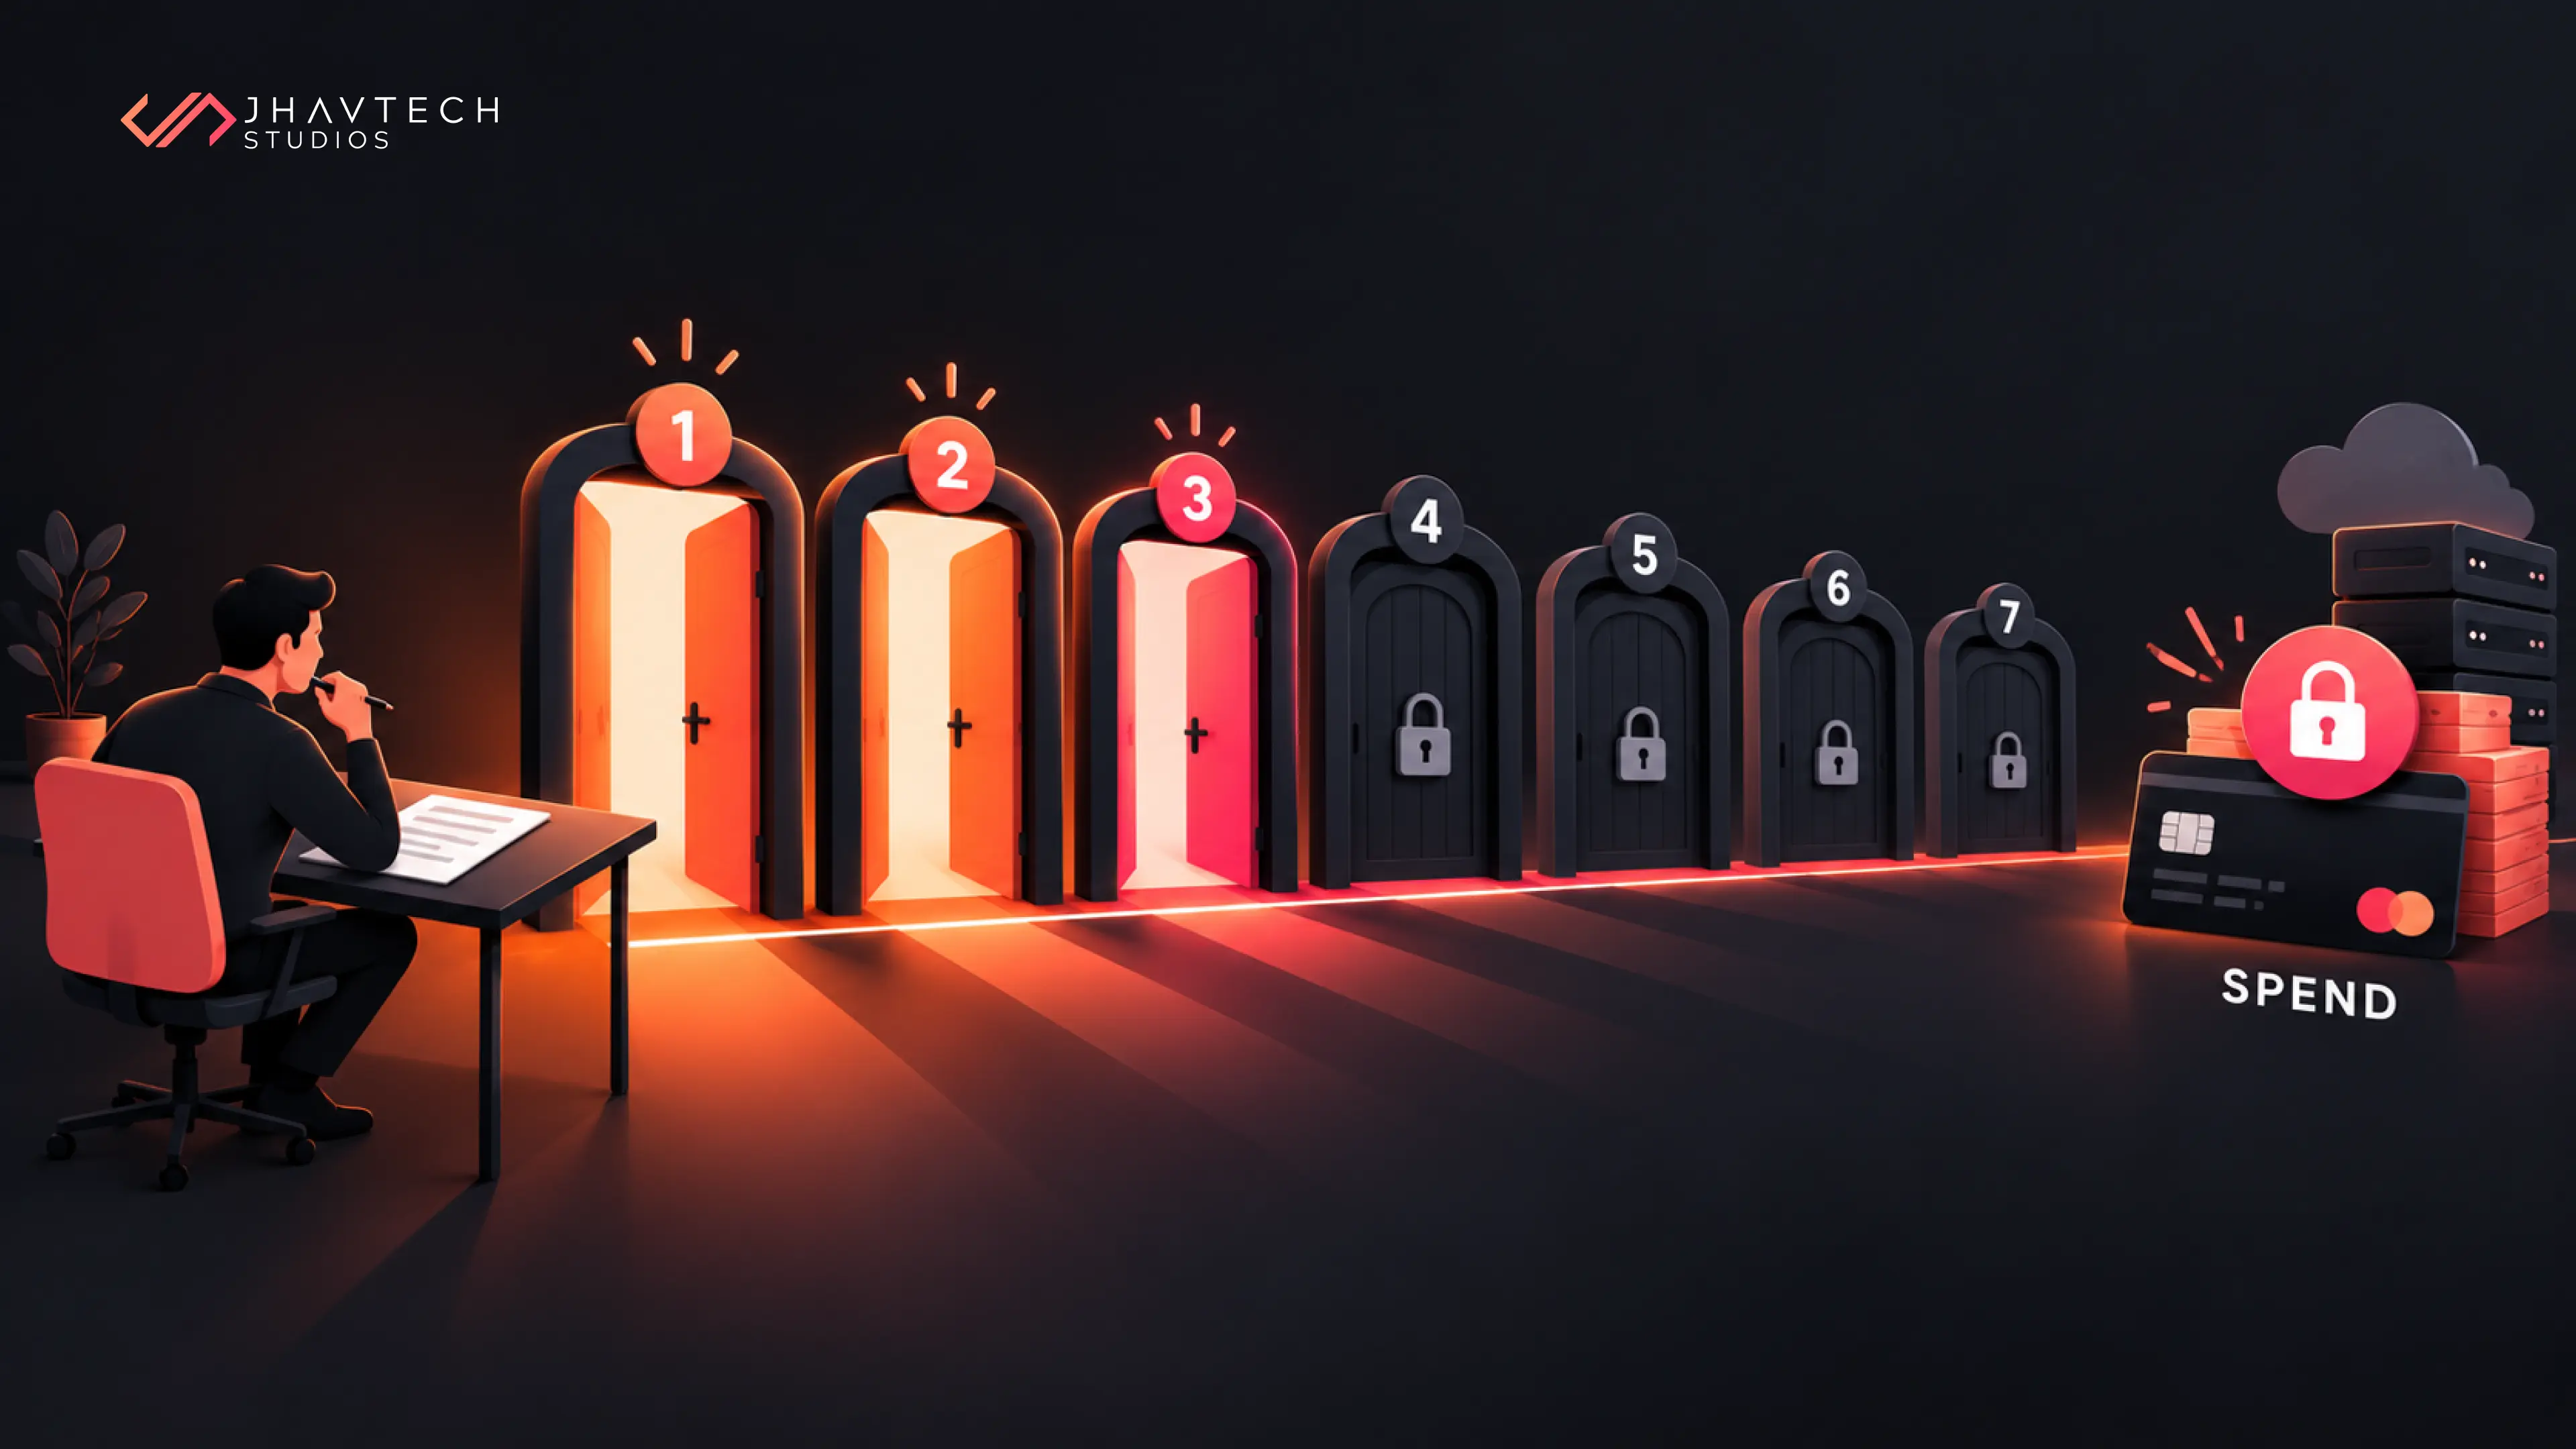
And if the investment on the table is a customer-facing product, the value case is usually clearer than people expect, because the measures are already in your funnel. That is the point where a purpose-built app your competitors cannot buy off the shelf starts to make commercial sense rather than just technical sense. Our breakdown of the seven decisions to get right before spending pairs well with everything above.
Frequently Asked Questions