How Do You Know When Your App Has Reached Its Scalability Limits?
A Melbourne booking platform rang us on a Tuesday. Their app had been fine for eighteen months. Then a radio segment mentioned them by name at 7:40am, traffic went up maybe nine times for about forty minutes, and the whole thing fell over... not gracefully. Payments half-processed, confirmation emails that never sent, a support inbox nobody could dig out of.
The founder's first question was the one everyone asks: how much bigger a server do we need?
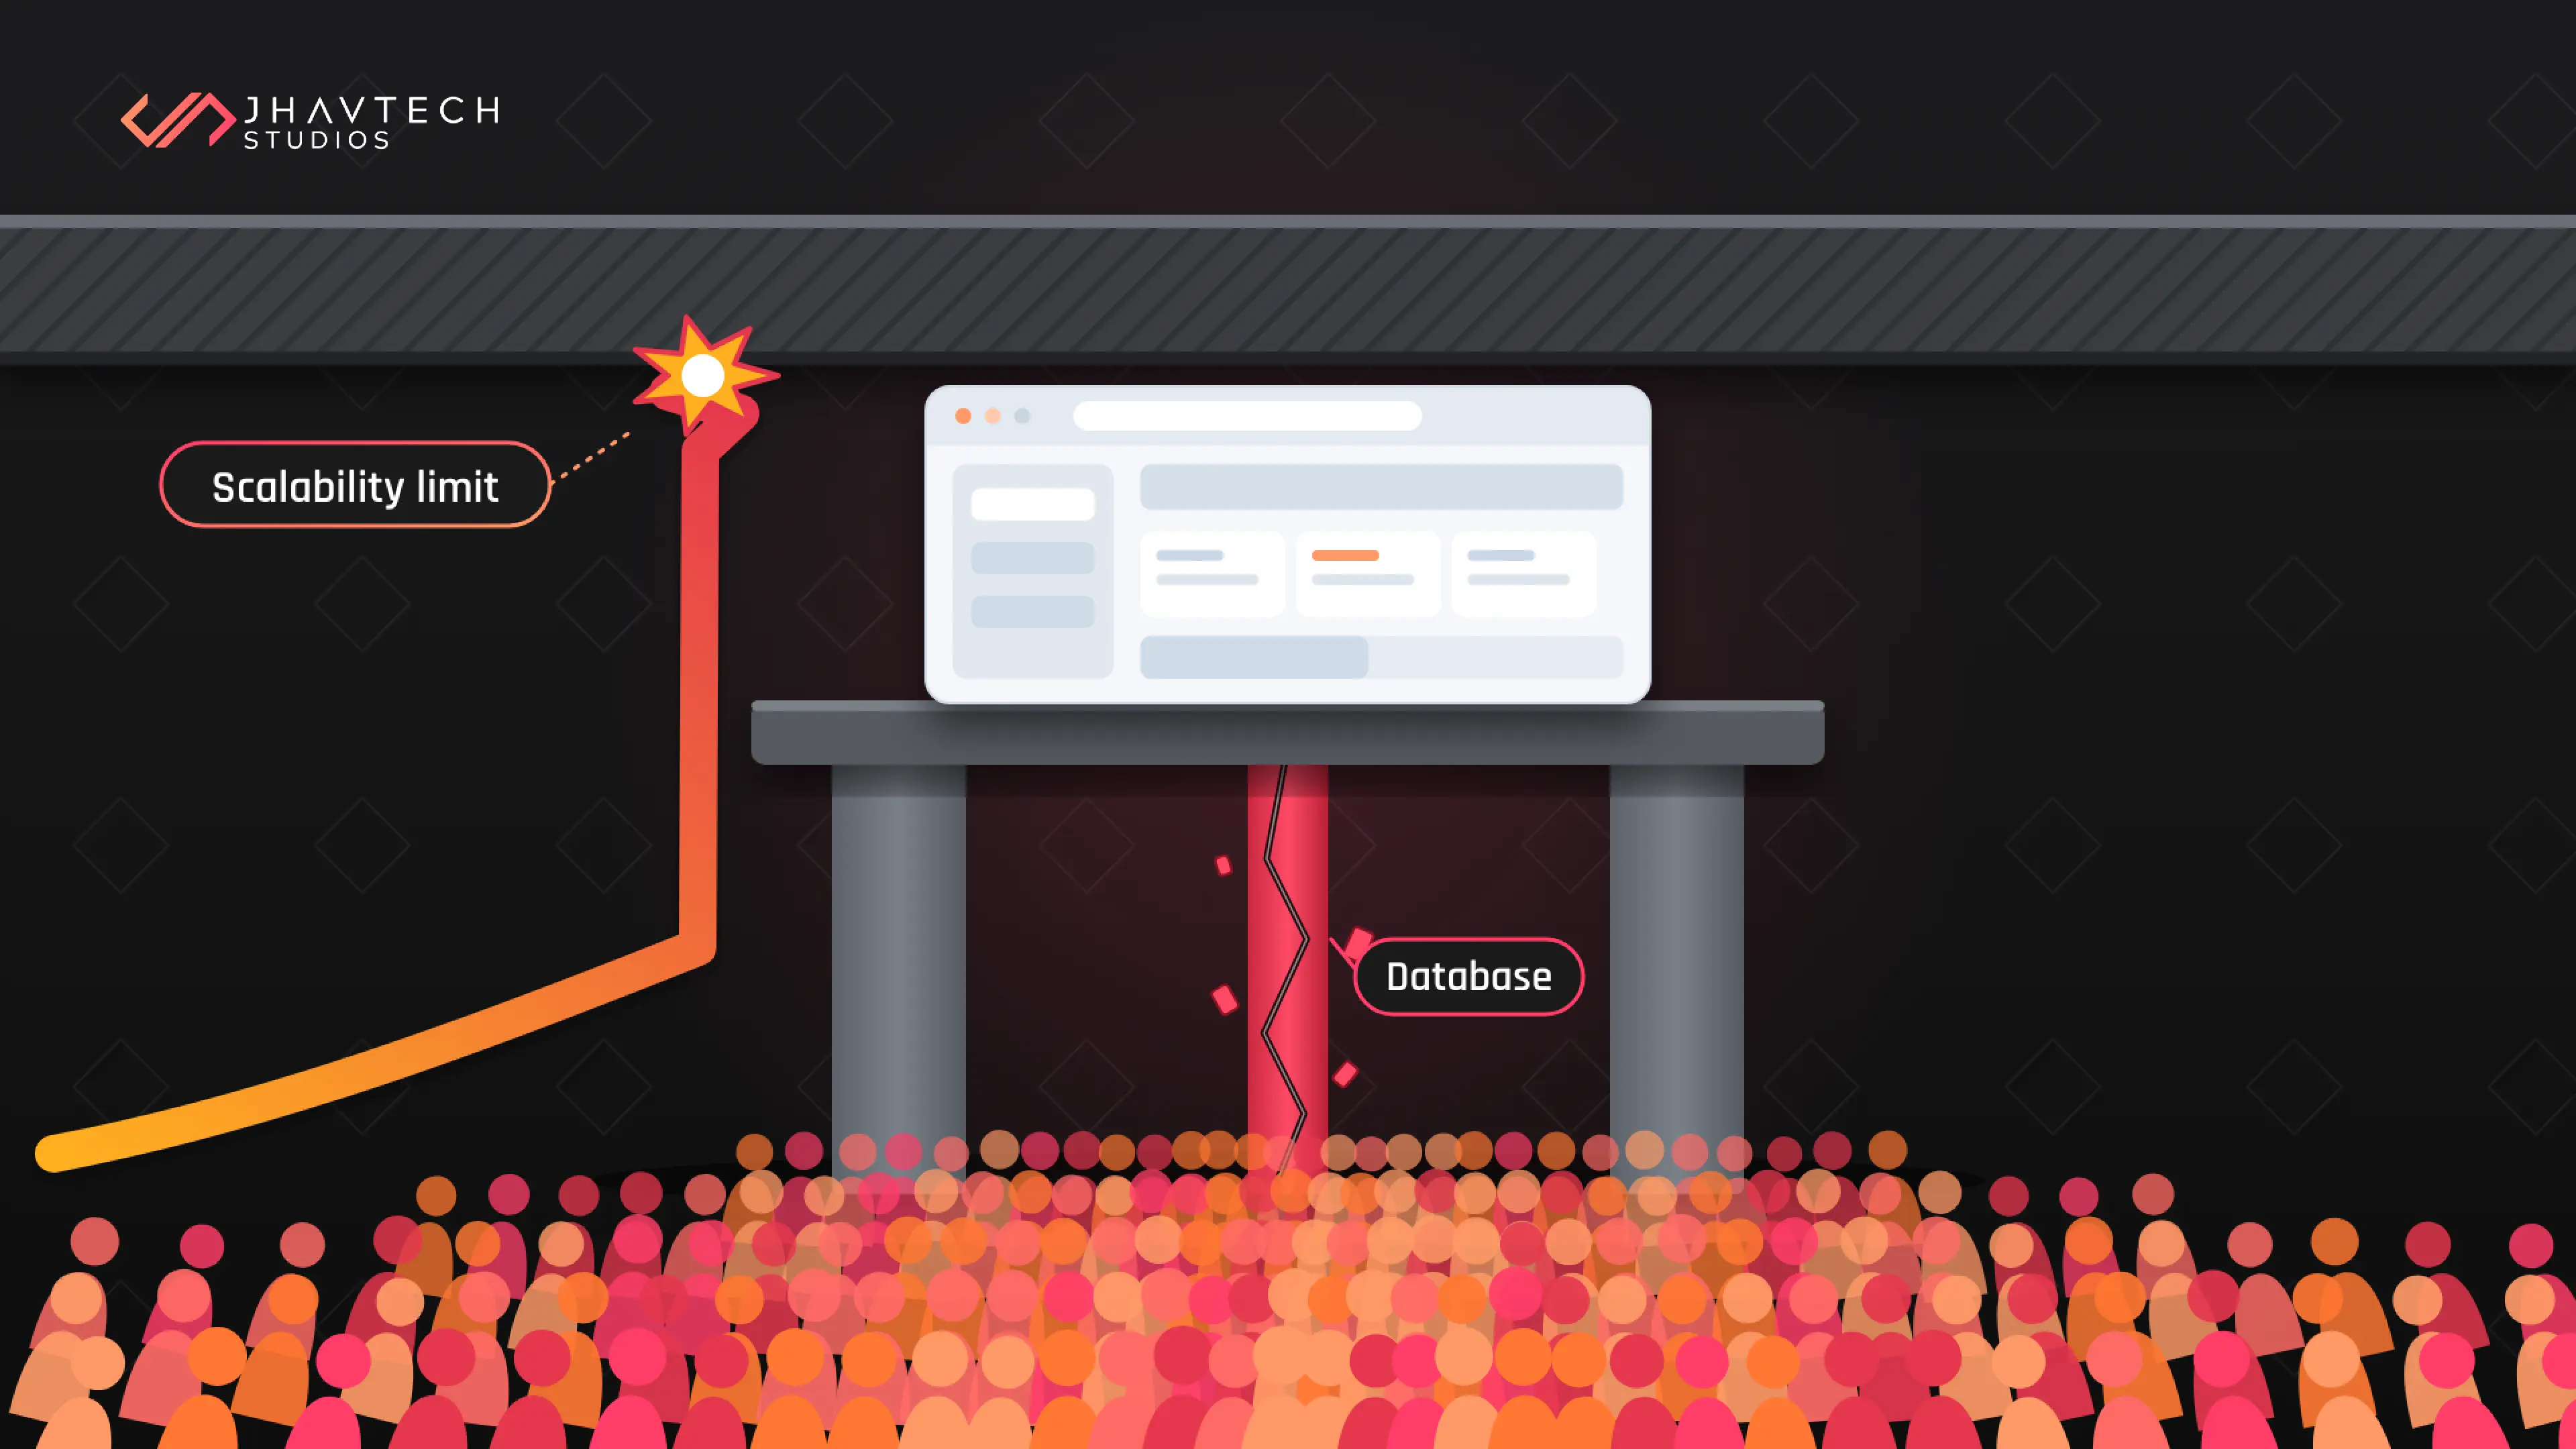
Wrong question. Their servers were barely sweating. The ceiling sat somewhere else entirely, in a connection pool capped at twenty, which meant the twenty-first simultaneous request queued behind the other twenty and waited its turn. More hardware would have changed nothing.
That is the awkward thing about software scalability limits. They rarely announce themselves. They show up as a slow Thursday, an odd spike in your cloud bill, a support ticket that reads "it was just hanging for me." By the time you get the dramatic version, you have usually been living beside the warning signs for months.
Summary: What You Need to Know
A scalability limit is a ceiling, not a slope. Performance holds steady, then collapses over a narrow band of extra load. The useful question is where that band sits, not whether your app feels fast today.
Six signals worth watching: response times that curve rather than climb, failures clustered at predictable hours, a database doing most of the suffering, hosting costs outrunning user growth, releases that get slower to deploy, and a roadmap shaped around what the system tolerates.
Splunk's 2026 research puts the average cost of downtime at US$15,000 per minute, with unplanned downtime costing Global 2000 companies around US$600 billion a year.
Google's study with Deloitte Digital and fifty-five, across 30 million sessions, found a 0.1 second speed improvement lifted retail conversions by 8.4%. Degradation costs money long before an outage does.
You can find your real ceiling in an afternoon. The load test plan, diagnostic table and 10-point checklist below give you a defensible number to take to your board.
What Is a Software Scalability Limit?
A software scalability limit is the point where an application's performance collapses rather than degrades, because one resource inside it has saturated and everything else is now queued behind it.
Most founders picture scaling as a gentle ramp. Twice the users, twice the load, slightly slower app. Tolerable.
Systems do not behave that way. They hold flat, flat, flat, then fall off a cliff inside a narrow band of extra load. Four hundred concurrent users are fine. Four hundred and fifty are fine. Five hundred and the request queue backs up, timeouts cascade, retries pile on more load, and the thing that was healthy ninety seconds ago is now unreachable.
That shape exists because every system has one resource that runs out first. A connection pool. A file lock. A third-party API's rate limit. A single-threaded job that everything else waits on. Until that resource is exhausted, extra load costs you almost nothing. After it, extra load costs you everything.
So "is our app fast?" tells you very little. "At what number does our app stop being fast?" tells you what to plan around.
Signal 1 - Response Times Curve Instead of Climbing
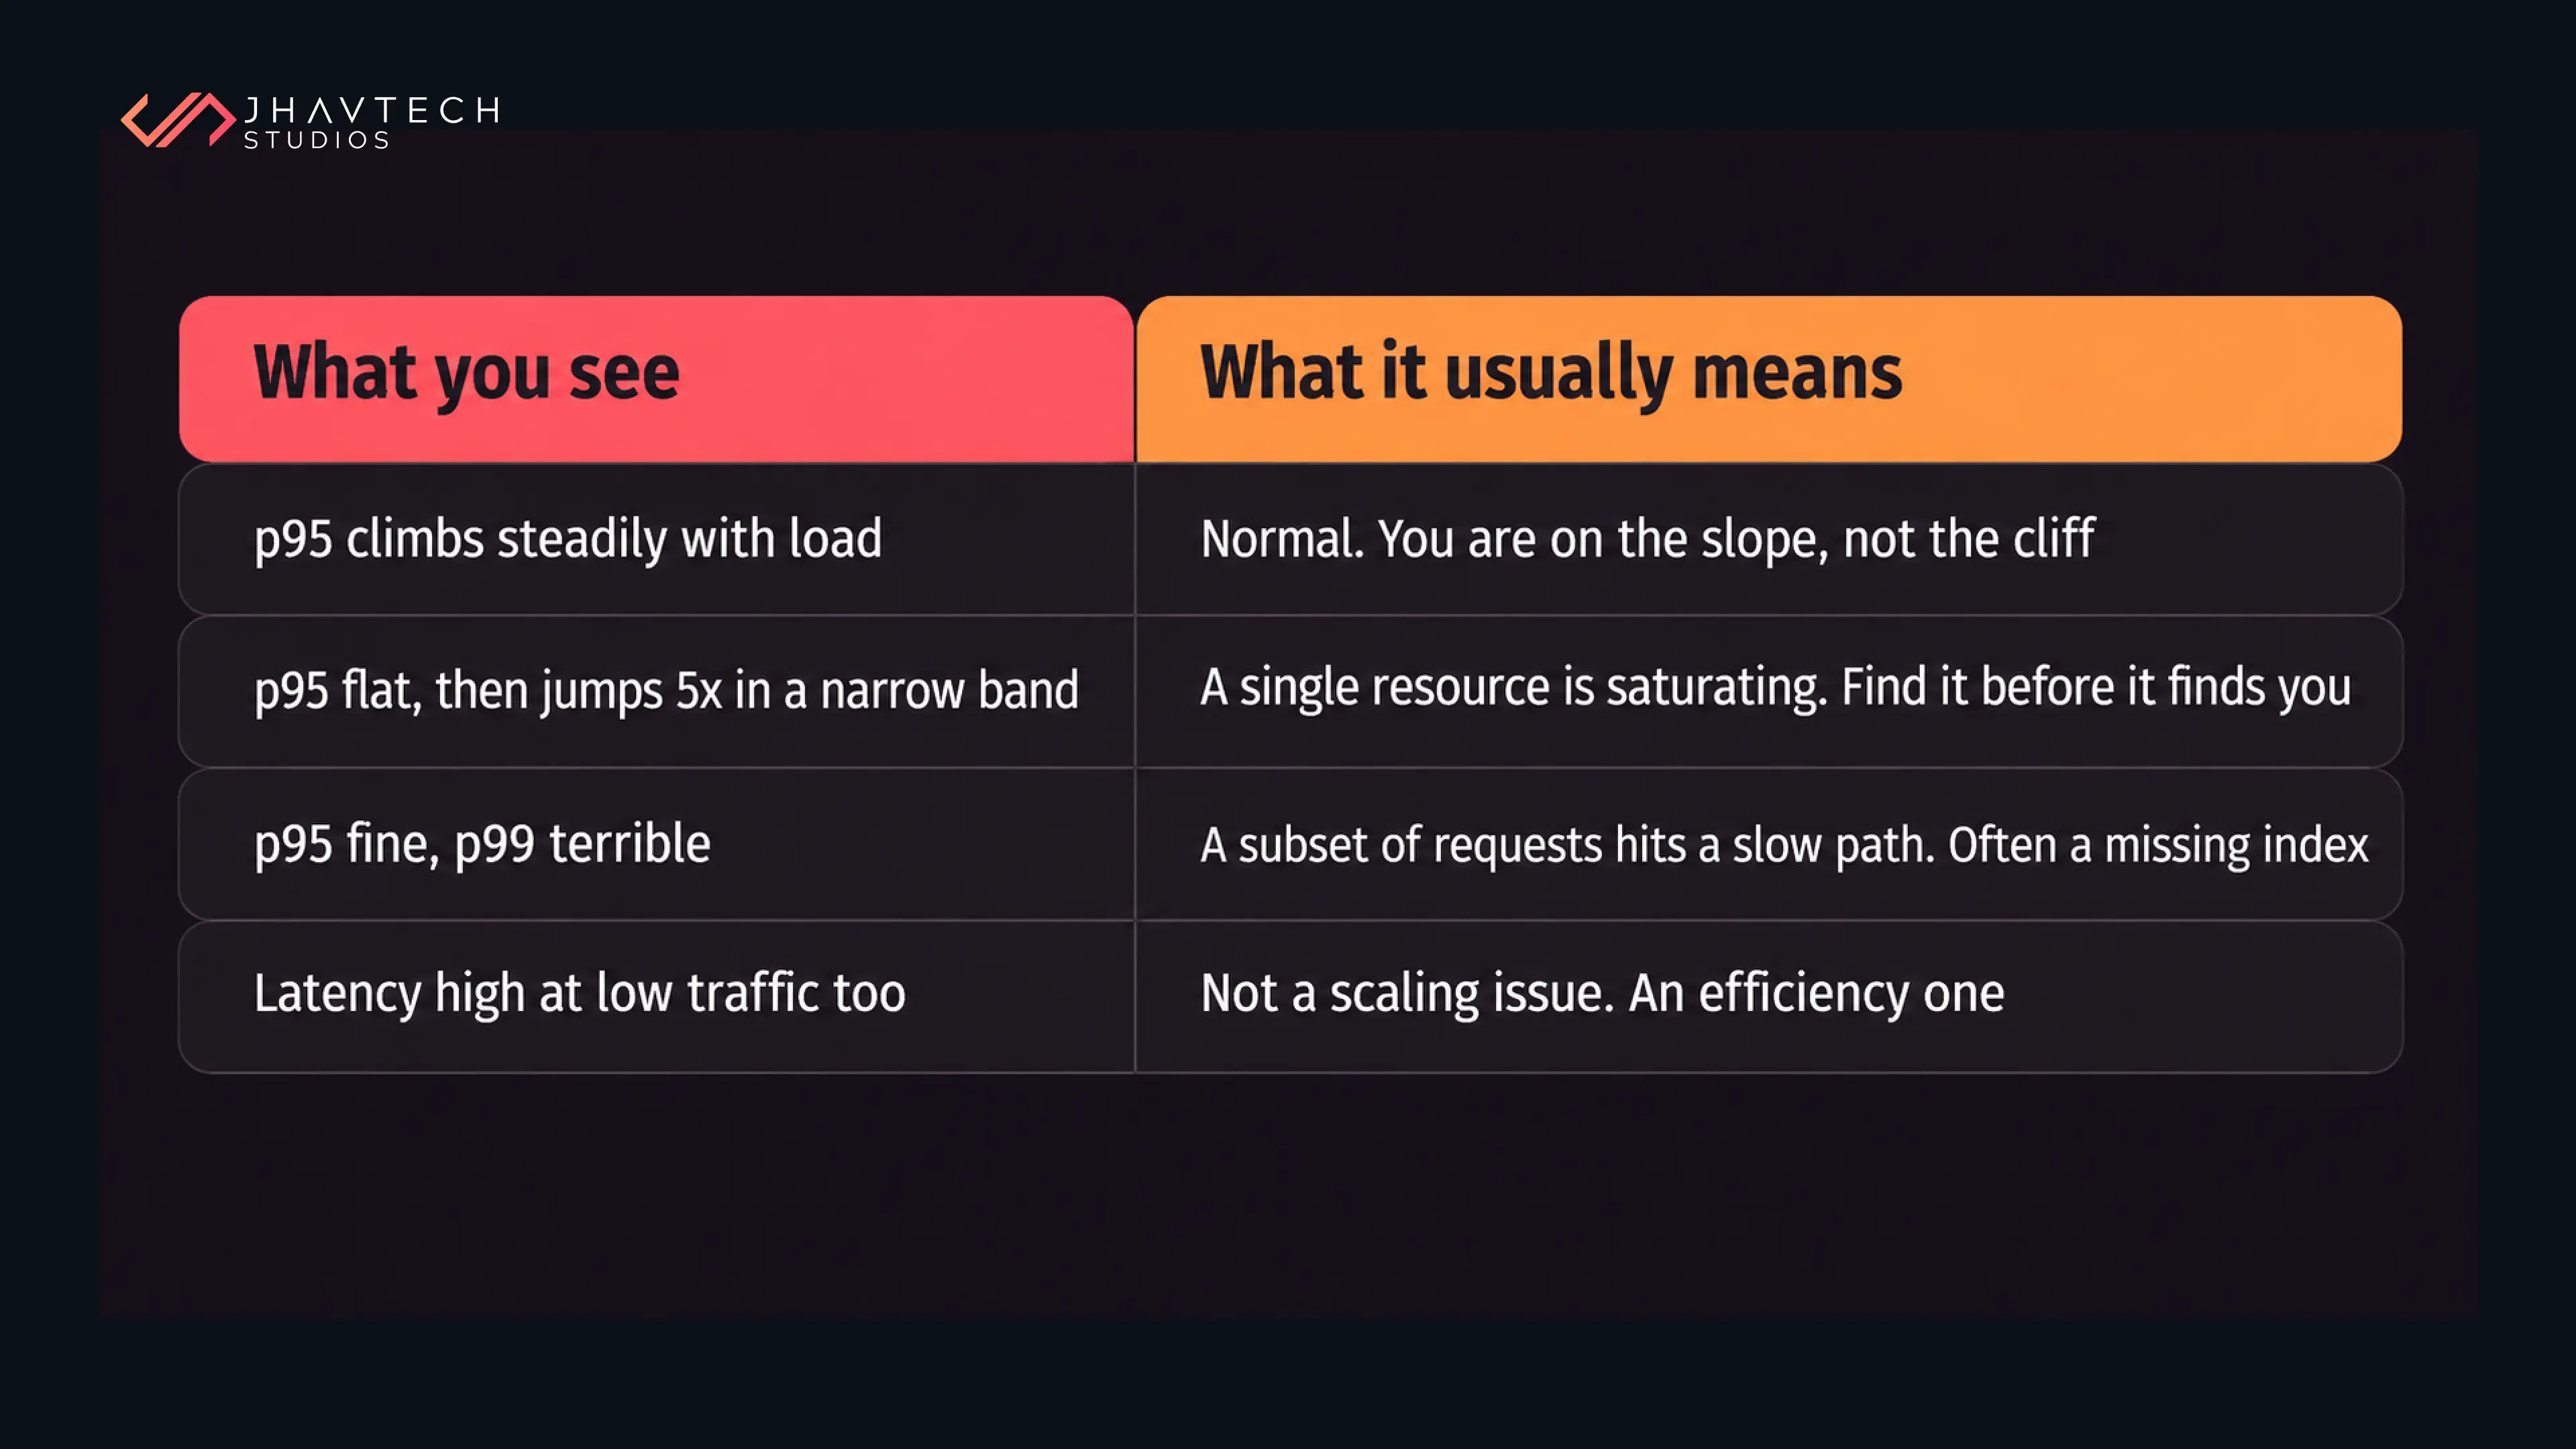
Pull your last ninety days of response data and chart p95 latency against concurrent users. Not averages. Averages hide the problem, because the customer having a terrible time is averaged away by nine customers having a fine one.
A healthy system draws a line that tilts up gently. A system near its concurrent user limits draws a hockey stick: flat, flat, flat, then a near-vertical wall.
Where that bend sits is your real number. If the bend is at 600 concurrent users and your Tuesday peak is 400, you have roughly 50% headroom. That sounds comfortable until marketing books a campaign.
Signal 2 - Failures Arrive on a Timetable
Random bugs are random. Scalability failures keep office hours.
If your incident log shows trouble at 9:05am on weekdays, or the first Monday of the month, or whenever payroll runs, that regularity is the finding. Your app is not unreliable. It is reliable right up to a load it cannot carry, and something in your business reaches that load on a schedule.
Export six months of incidents and sort by hour of day. The pattern tends to be obvious once you look, and most teams have never looked.
The cost of ignoring it has moved. Splunk's 2026 research, published through Cisco, puts the average cost of downtime at US$15,000 per minute and the aggregate bill for Global 2000 companies at roughly US$600 billion a year, up 50% in two years (Cisco Newsroom). An SME will not lose $15,000 a minute. An SME will lose the enterprise client who watched the app die during their own pilot.
Signal 3 - Database Bottlenecks Are Doing Most of the Damage
In our experience, when a growing app stops scaling, database bottlenecks are behind it more often than everything else combined. Application servers clone easily. Your database does not.
Four questions to put to your technical lead:
- How many of our slowest queries have no index? Postgres and MySQL both log slow queries. Nobody reads the log. A query that scans 50,000 rows is invisible at 500 users and fatal at 5,000.
- Do we have N+1 queries on our busiest screens? This is the pattern where loading a list of 100 items fires 101 separate queries instead of two. It never appears in testing with ten records. It appears the week you have real data.
- What is our connection pool size, and what happens at the limit? The Melbourne booking platform's entire outage lived in this one answer.
- Are reads and writes competing? A reporting query that locks a table everyone needs will drag the whole product down while it runs.
Our breakdown of why apps stop scaling and what actually fixes it goes through each of these with the remedies attached.
Signal 4 - Hosting Costs Outrun User Growth
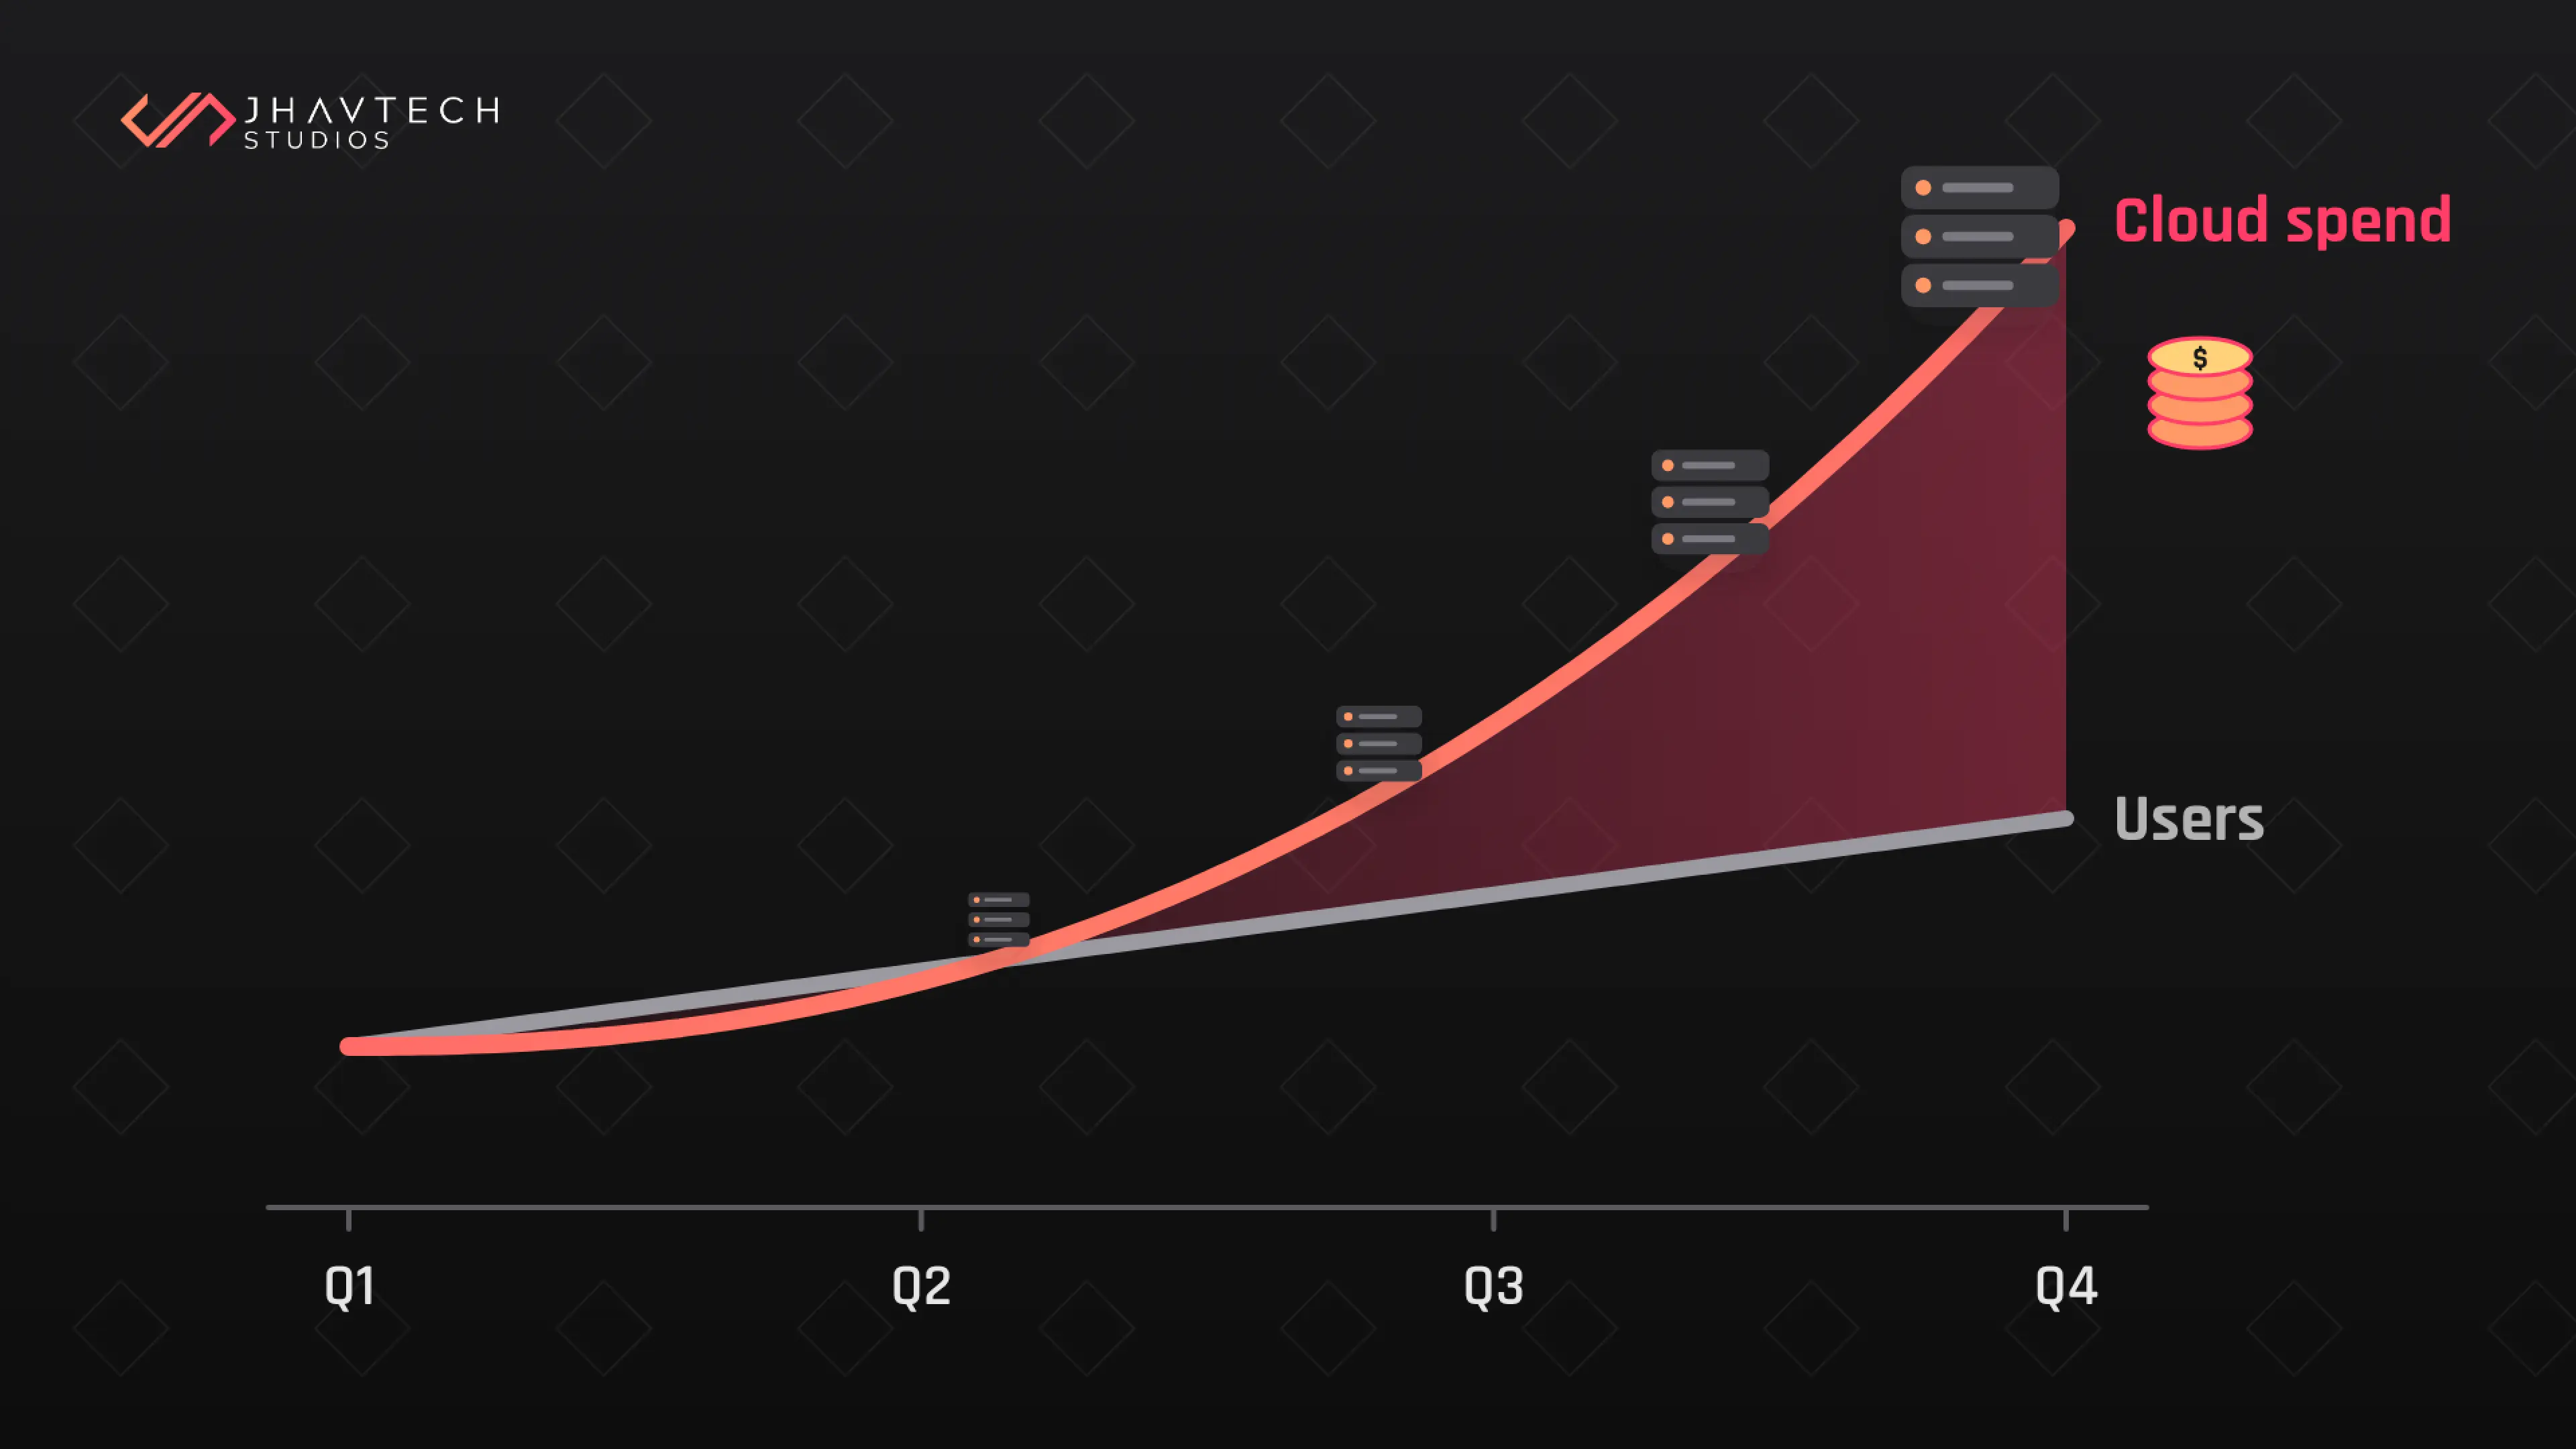
Plot monthly cloud spend against monthly active users for the past year. Two lines, same chart.
In a system with room to grow, cost per user falls as you grow. You are amortising fixed infrastructure across more people. When cost per user rises instead, somebody has been solving inefficiency by buying bigger instances. It works. It is also the most expensive way yet devised to postpone a fix.
This is where server capacity planning stops being an infrastructure chore and becomes a finance question. If hosting climbed 60% while users climbed 25%, you are not scaling. You are paying a premium to delay a conversation, and the premium compounds every month.
A Brisbane SaaS business we assessed last year had tripled its hosting spend over four quarters while paid seats grew by about a third. Nobody had connected the two numbers, because the invoices arrived monthly and the growth reports arrived quarterly and the two lived in different slide decks. The cause was a single analytics dashboard recalculating every customer's figures on page load rather than overnight. Six weeks of oversized instances had cost more than the fix did.
Check your autoscaling rules while you are there. A surprising number of them fire after the damage, spinning up capacity two minutes into a spike that lasted ninety seconds.
Signal 5 - Deploys Have Got Slower and Scarier
This signal is about people, and it arrives early.
Does a routine release take longer than it did a year ago? Does anyone deploy on a Friday? Has the team quietly started batching changes into bigger, rarer releases?
That last habit is the tell. Teams batch up when they have stopped trusting how the system behaves under load, and batching makes each release riskier, which encourages more batching. Your delivery rhythm gets set by the system's limits before anyone has written those limits down.
Signal 6 - The Roadmap Has Started Negotiating
"We can't offer that in Europe, latency would be bad."
"Let's cap the trial at 50 seats."
"Bulk import is a phase two thing."
Said once, that is prioritisation. Said every quarter about the same constraints, your architecture has joined the strategy meeting and started voting. We wrote about where that road ends in how to choose software architecture that holds up as you grow.
The test question: if a competitor launched the thing you keep deferring, could you respond within eight weeks? When the honest answer is no, and the blocker is the system rather than budget or headcount, you have found your limit. You just found it through your roadmap instead of your monitoring.
How to Test App Scalability in a Single Afternoon
Signals point. Application load testing proves. You can run a credible one in half a day with k6, Locust or JMeter, and the output is a number you can put in a board pack.
Step one: pick one journey that matters. Not the home page. The checkout, the booking, the login then search then save sequence. Script it end to end.
Step two: use realistic data. Testing against 200 seeded records tells you nothing. Clone a production-sized dataset, stripped of personal information. Query behaviour at 10,000 rows and 10 million rows is a different animal.
Step three: ramp until it breaks. This is the part teams skip because it feels destructive. Start at today's typical load. Add 25% every five minutes. Keep going past the point of comfort. You want the number where p95 latency doubles and the number where errors begin, and the gap between them is your warning window.
Step four: watch all four resources at once. CPU, memory, database connections and disk I/O. The one that saturates first is your bottleneck. Everything else is a passenger.
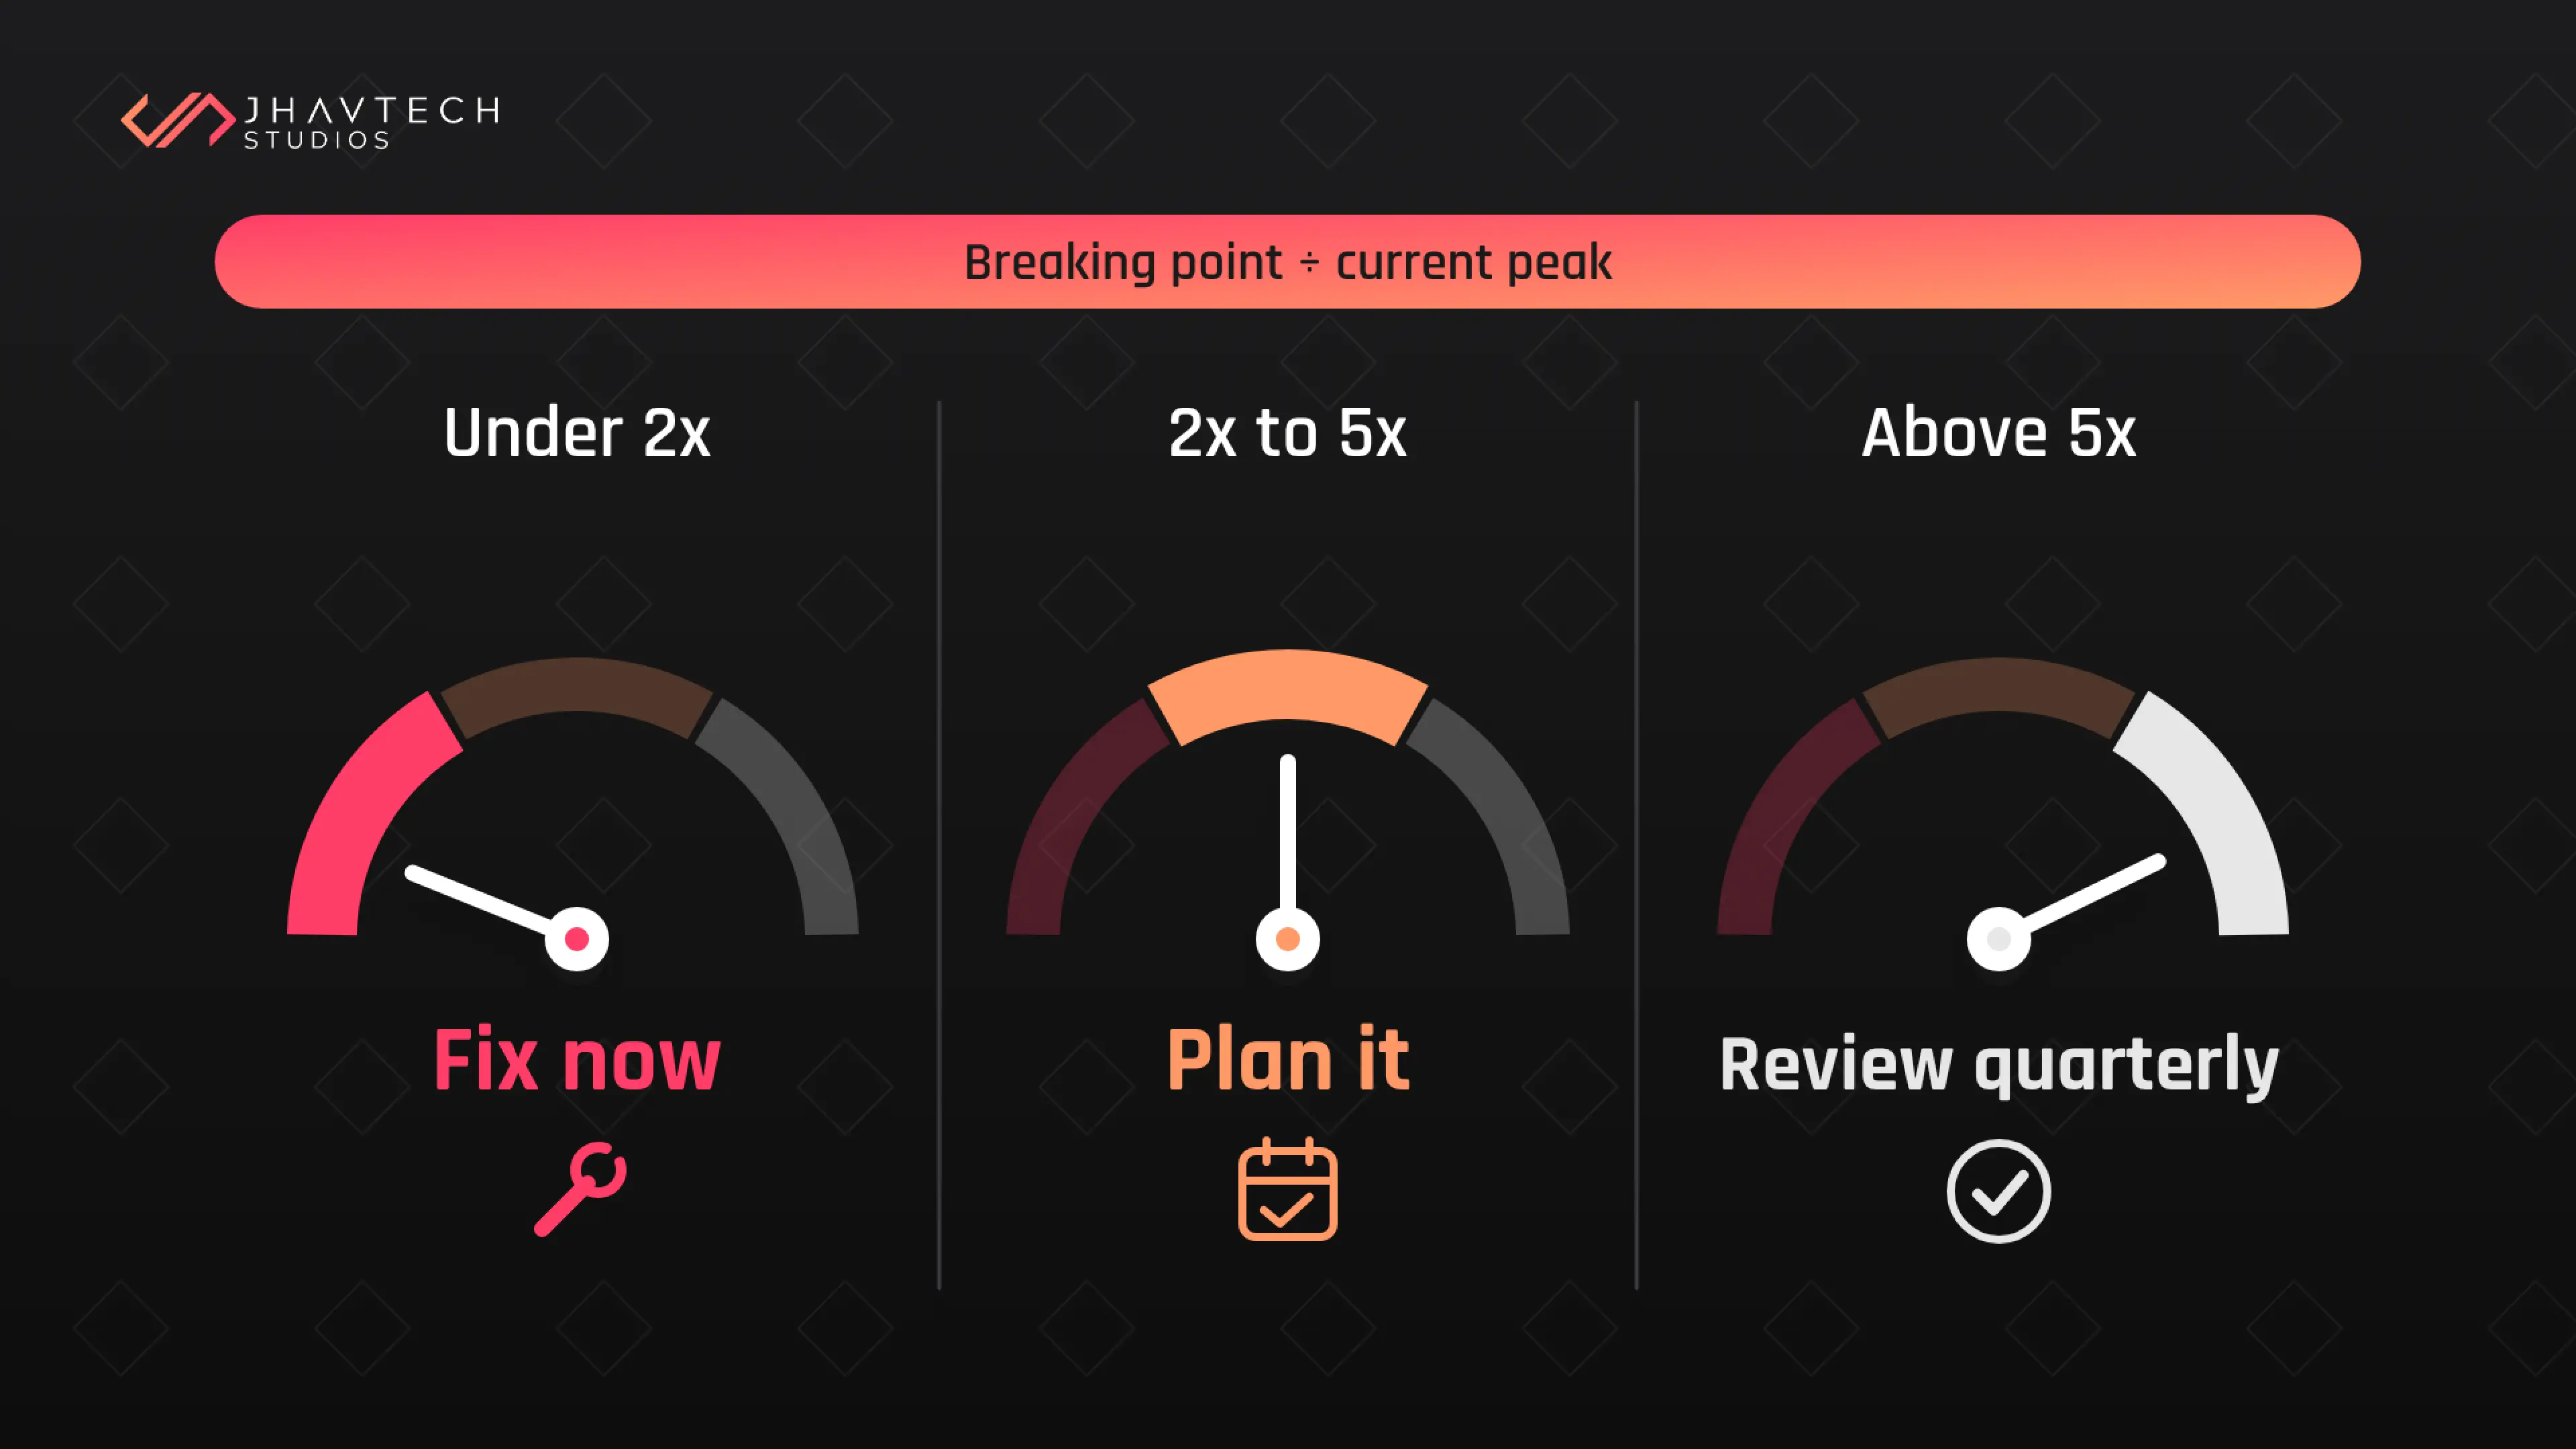
Step five: write down the ratio. Breaking point divided by current peak. Under 2x, start planning now. Between 2x and 5x, you have a quarter or two. Above 5x, revisit in six months.
Run this quarterly and after any significant feature release. Degradation matters even when nothing breaks: Google's research with Deloitte Digital and fifty-five, covering 30 million user sessions across 37 brands, found a 0.1 second improvement in mobile site speed lifted retail conversion rates by 8.4% and average order value by 9.2% (web.dev case study). That is a tenth of a second. Your slow Thursday is costing you more than you think, and it is costing you quietly.
Worth noting on timing: more infrastructure before you understand the bottleneck usually makes things worse, which we covered in why scaling too early can destroy product performance.
The 10-Point Scalability Limits Checklist
Tick what is true today. Four or more, book an assessment before your next growth push.
☐ You cannot state your app's breaking point as a number
☐ Response times have worsened without a matching rise in users
☐ Incidents cluster at predictable times or dates
☐ Slow query logs exist but nobody reviews them
☐ Cloud spend is growing faster than active users
☐ One database serves every read and write, with no caching layer
☐ Load testing has never been run against production-sized data
☐ Deploys take longer and happen less often than a year ago
☐ A feature has been deferred because of system constraints
☐ Your monitoring tracks averages rather than p95 and p99
What to Do with the Number
Three ceilings, three responses.
Under 2x headroom. Stop feature work on anything that adds load. Fix the one saturating resource. It is usually a database bottleneck, and usually cheaper than anyone expects: an index, a cache, a connection pool resized, a report moved off the primary.
Between 2x and 5x. You have time to do this properly. Sequence by business impact. Checkout before the admin screen nobody opens. Build load testing into your release process so the number gets checked rather than assumed.
Above 5x. Record the number, set a quarterly review, and go back to building product. Over-engineering for scale you do not have is its own expensive mistake.
Whichever band you land in, the sequence holds: measure, fix the one thing that runs out first, measure again. Teams that skip to the fix tend to optimise the most visible thing rather than the binding one, and the ceiling stays exactly where it was.
A proper software scalability audit covers five things, and an afternoon of load testing only gets you the first: your breaking point, the resource that saturates first, your query and index health, your caching and connection strategy, and whether your monitoring would tell you any of this before a customer did.
If what you find is structural rather than a tuning job, you have two reasonable paths. Build the next version on an architecture designed to carry the load you are heading towards, or, when the system is live and buckling and you cannot take it offline to fix it, bring in a team that specialises in stabilising software under real traffic. Most of that work runs in the same order every time: audit first, stabilise the paths that carry money, improve once the ground is solid.
Where This Leaves You
Your app has a ceiling. It had one the day it launched. The only question is whether you know the number or find out during your best week of the year, which is precisely when load peaks and precisely when the cost of failing is highest.
The number has a shelf life. Every feature that adds a query, every month of data piling up behind your busiest screen, moves the ceiling, usually down. A breaking point measured in March and quoted in November is not a measurement, it is a memory.
What the number really buys you is a different conversation. “Is the app fast enough?” gets answered with opinion, and whoever is most worried wins. “We hold to 600 concurrent, we peak at 400, and lifting it costs roughly this much” is a planning input anyone can act on without needing to understand connection pools.
Find the number. Review it quarterly, and again whenever peak load passes half the ceiling. Keep it somewhere your board can see it.
Frequently Asked Questions