.svg)
.svg)
As a founder or business owner, you have a million things competing for your attention: product market fit, funding rounds, team culture, and, crucially, user retention. There’s one silent killer, however, that can sabotage all your hard work without a single crash report: a slow server.
It doesn’t just feel bad; it directly impacts your bottom line. We’re talking about a measurable, financial cost tied to a fundamental technical problem. At Jhavtech Studies, we’ve seen brilliant startups stumble because they treated performance as an afterthought.
This article is your tactical guide to fixing that. It’s time to move past basic uptime alerts and implement a truly comprehensive server health check strategy.
The Financial Black Hole of Bad Performance
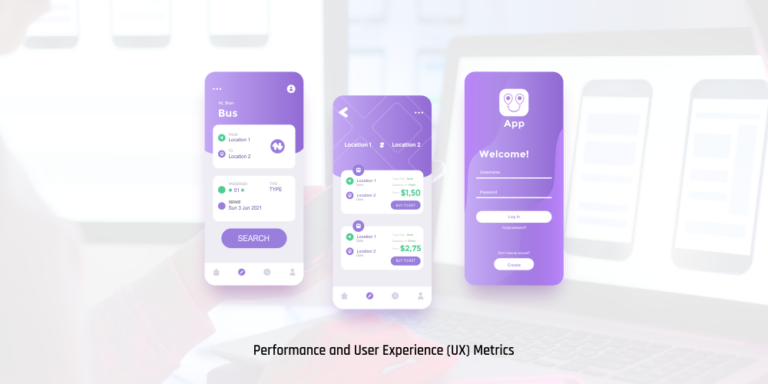
Let’s be blunt: users have zero patience. We live in an instant gratification economy, and every fraction of a second matters. This is especially true for modern applications, where the success of your mobile app development hinges on responsiveness.
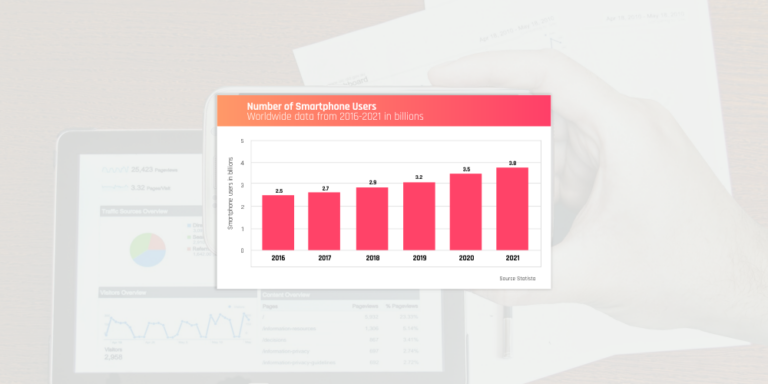
Consider these recent statistics: Studies show that even a one-second delay in page load time can lead to a 7% reduction in conversions. For a growing e-commerce or SaaS platform, that’s tens or hundreds of thousands of dollars vanishing into thin air. Furthermore, the probability of a mobile site visitor bouncing increases by a staggering 123% as page load time goes from one second to ten seconds.
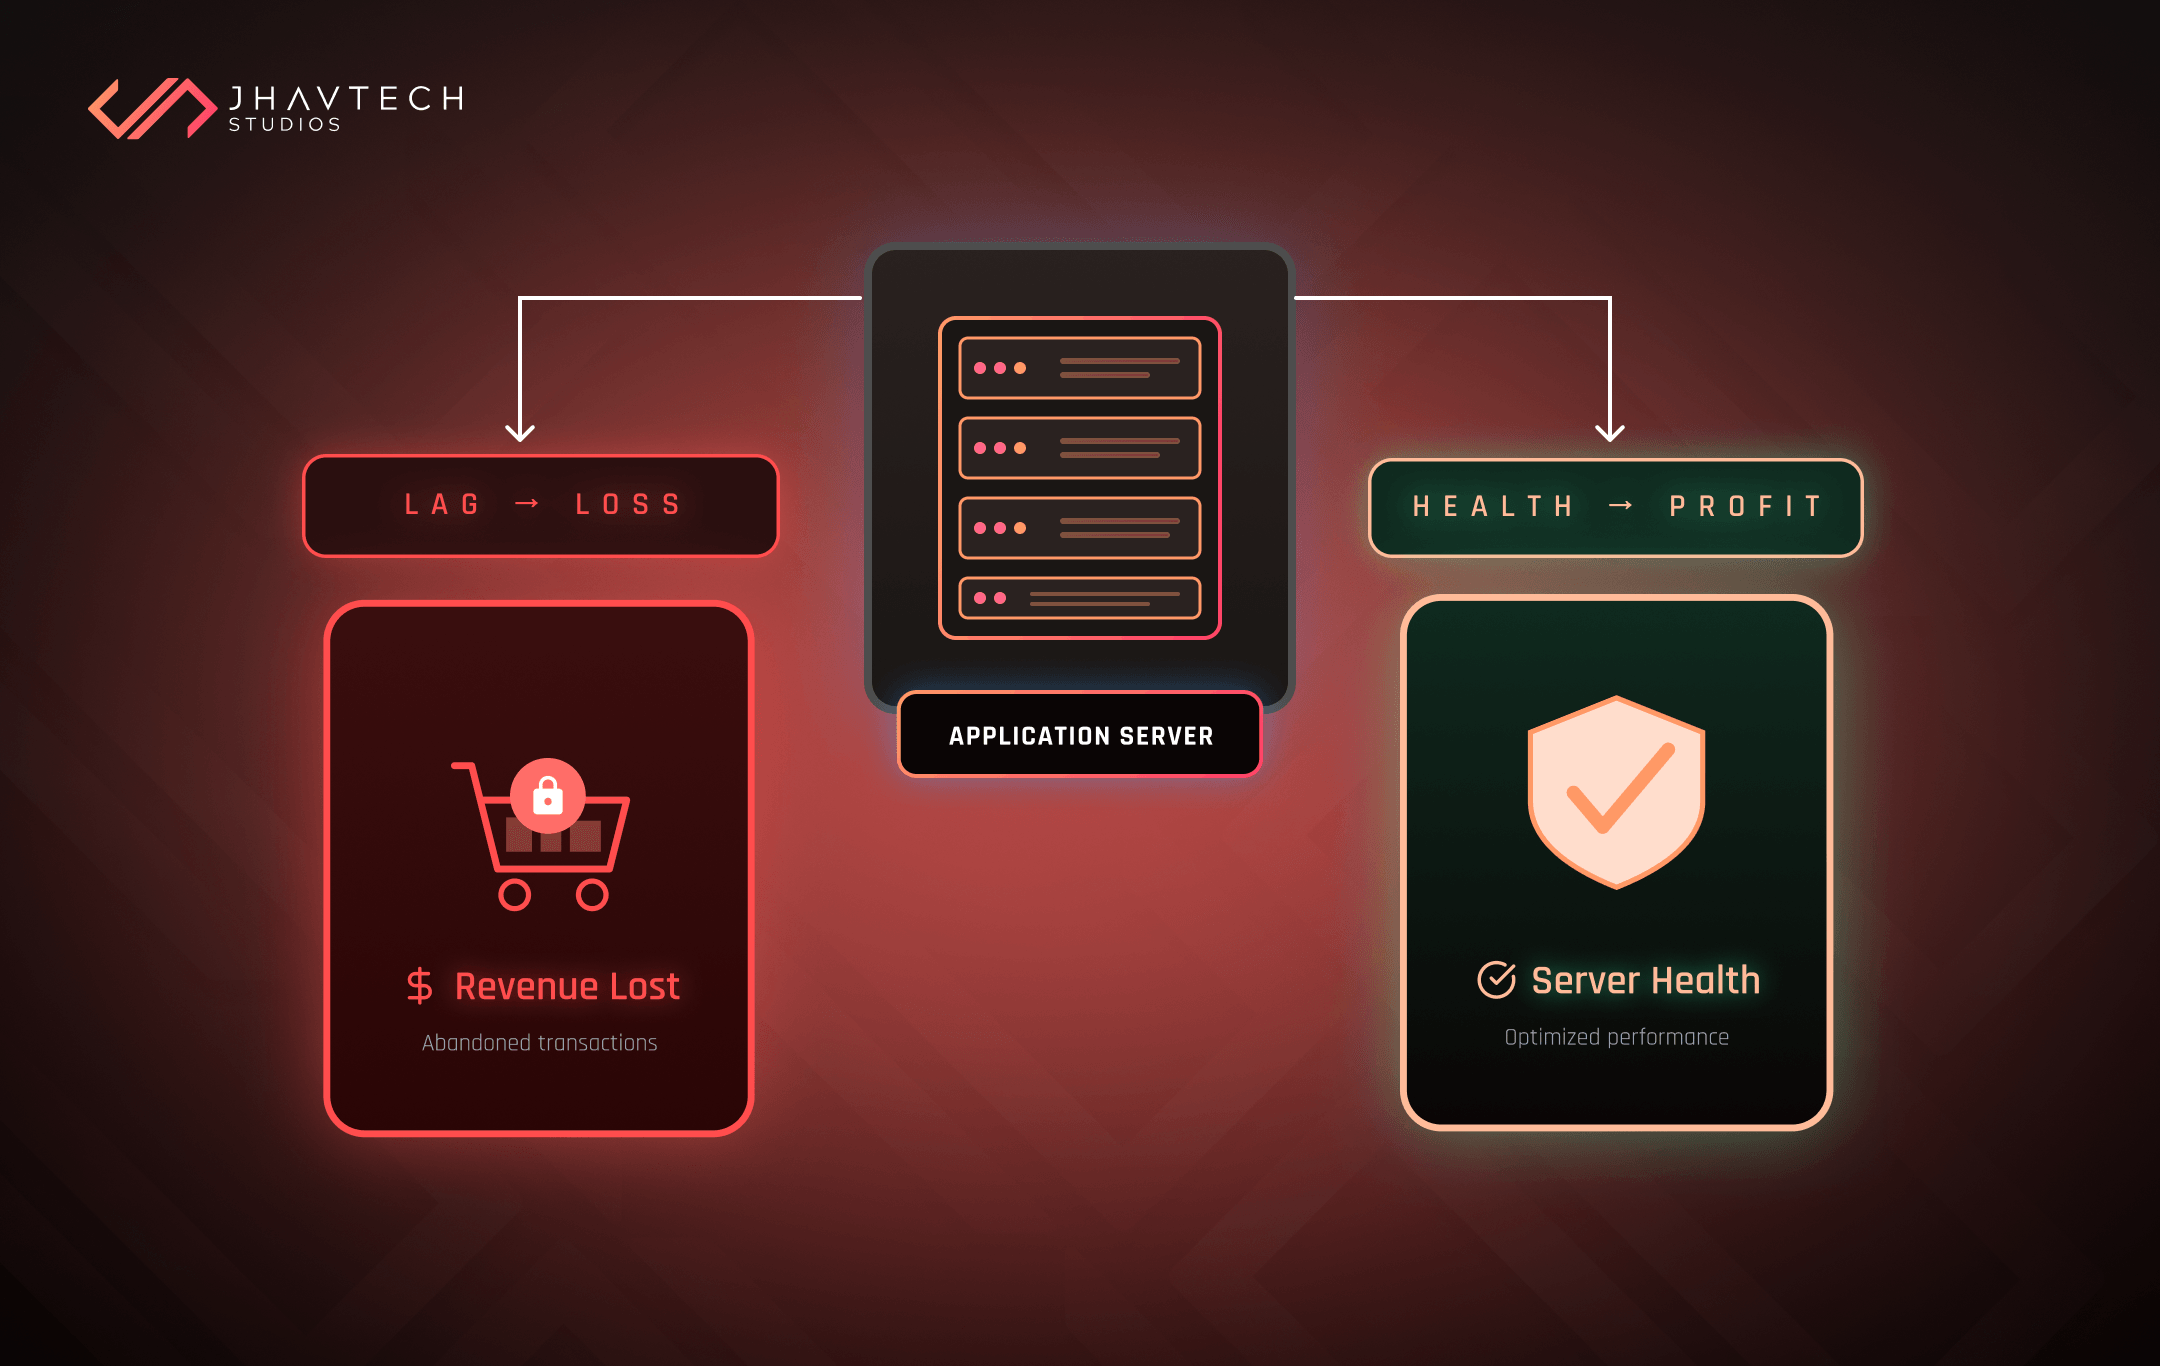
This is the real cost of latency.
Your customers aren’t just annoyed; they are switching to your faster competitor. An unreliable or slow application feels low-quality, regardless of how well-designed your UI is. A robust, proactive server health check is the only way to safeguard your user experience and protect your revenue.
Setting the Standard: What a Real Server Health Check Looks Like
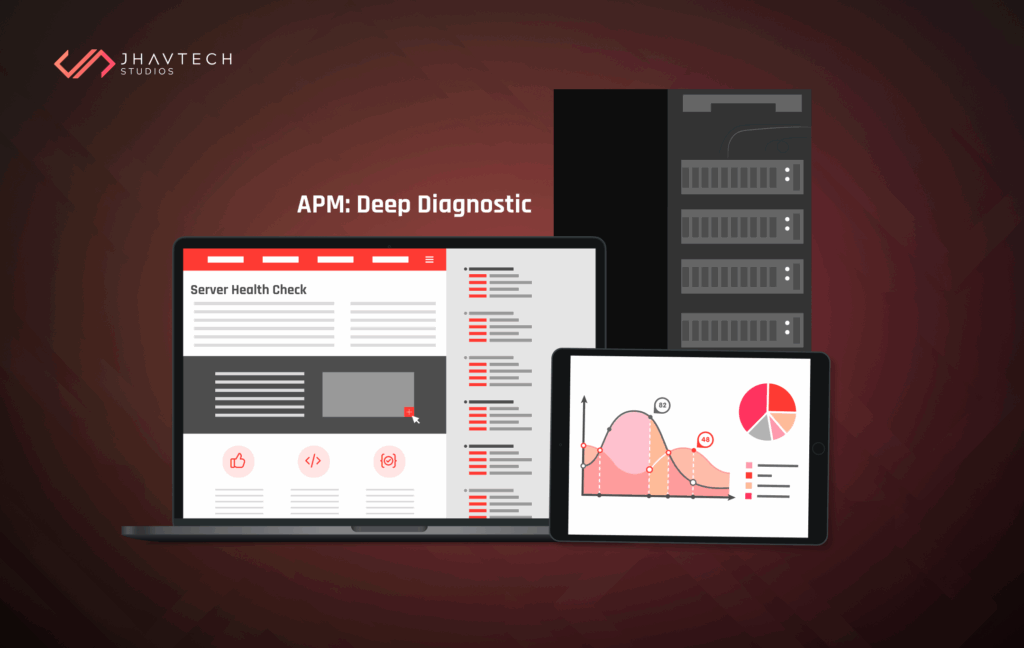
A basic “ping” test to see if your server is online is not a server health check. That’s the digital equivalent of checking if a patient is breathing. A real health check is a deep diagnostic that answers a much more critical question: Is the server healthy enough to perform its core function quickly and reliably? After a thorough code review, we often find that slow performance isn’t just a server issue, but a code efficiency issue manifesting as server strain.
To answer this, we need to move from simple uptime monitoring to server monitoring and detailed application performance monitoring (APM).
Critical Metrics Your Server Health Check Must Track
The core health of your server is defined by four primary resource utilisation metrics. If any of these hit a critical threshold, the server is “sick” and must be flagged or automatically healed. If you are unsure how to interpret this data, expert IT consulting can provide the necessary guidance.
- CPU Utilisation: A consistently high CPU is a sign of inefficient code or simply not enough processing power for the current load.
- Memory (RAM) Usage: High memory usage, especially when approaching 90% or more, often leads to “swapping,” where the system uses the much slower disk space as virtual memory. This is a primary source of lag.
- Disk I/O and Space: High Disk I/O (Input/Output) means the server is spending too much time reading and writing to the hard drive, a major bottleneck. A full disk also causes catastrophic failures.
- Network Latency: This is the time it takes for a request to travel to the server and back. High latency often points to network congestion, firewall issues, or geographical distance between the user and the server. This is where we measure the millisecond cost mentioned in the title.
Server Health Check Best Practices: The Founder’s Tactical Playbook
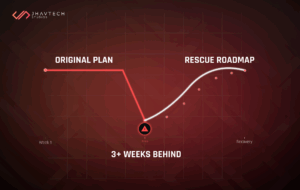
Implementing a world-class monitoring system doesn’t have to be complex, but it must be methodical. If you find your team constantly firefighting server issues, it might be time for a comprehensive software project rescue effort, which starts with a detailed server assessment.
1. Distinguish Liveness from Readiness
This is a server health check best practices principle that is vital for modern, load-balanced applications.
- Liveness Check (Is it alive?): A basic ping or heartbeat check. If this fails, the server must be restarted.
- Readiness Check (Is it ready to take traffic?): This check is more in-depth. It confirms the server is not only running, but also that it has connected to its dependencies (database, caching layer, third-party APIs) and is warmed up and ready to handle user requests. If this fails, the load balancer should be told to temporarily stop sending new traffic to that specific instance, but the server shouldn’t necessarily be restarted. This prevents a sick server from causing an outage.
2. Implement the Auto-Healing Loop
For modern cloud infrastructure, monitoring must be paired with automated response. This is the heart of DevOps philosophy. Your server monitoring tool shouldn’t just send an alert to your engineer at 3 AM. It should act.
When a server health check fails its “readiness” criteria three times in a row, the automated process should:
- Remove it from the load-balancer pool.
- Spin up a fresh, new instance to replace it.
- Log the problem instance for later forensic analysis (which is a great opportunity for a subsequent code review).
This process—diagnose, isolate, replace—is a major element of building a resilient application.
3. Specific Environment Monitoring: How to check server health Linux
Since a large number of web servers and cloud environments run on Linux, knowing where to look is key. For those systems, your agents need to be configured to specifically track:
- Load Average: This is a crucial metric on Linux systems, showing the number of processes waiting for CPU time. A load average significantly higher than the number of CPU cores is a major red flag.
- I/O Wait: The percentage of time the CPU spends idle, waiting for disk input/output to complete. A spike in I/O Wait suggests a severe disk bottleneck.
Practical tools like top, htop, and iostat are your command-line friends, but using agent-based Application Performance Monitoring (APM) tools like Datadog, New Relic, or Dynatrace is the enterprise-grade solution for continuous, automated monitoring.
The Jhavtech Studies Perspective: Proactive Reliability
At Jhavtech Studies, our mission is to ensure your app scales reliably. We know that poor performance is often a symptom of underlying architectural issues or legacy code. It’s why we advocate for and offer services like code review early in the mobile app development lifecycle to prevent slow queries and memory leaks before they ever require a midnight server health check alert.
If your performance issues feel chronic, or if your engineering team is constantly firefighting, it may be time for a fresh, expert look. Our software project rescue approach often begins with a deep diagnostic of your server’s current health and overall infrastructure architecture. The fix isn’t just buying bigger servers; it’s optimising the code and architecture that runs on them.
Your Next Step: Audit Your Server Health Check Strategy Today
Your application’s speed is your competitive edge. Stop treating a slow server as an unfortunate, occasional event. Treat it as a critical business problem with a direct impact on customer loyalty and revenue. Implementing robust DevOps practices is essential for success.
Your current system should answer this question 9 times out of 10: “Is my server fit for duty?” If the answer is anything less than an instant, confident “Yes,” you have work to do.
Implement the robust server health check practices discussed here. Use APM tools to gain full visibility. Build auto-healing into your DevOps pipeline. This proactive approach will free up your engineering team to focus on innovation, not on fighting the fires caused by a perpetually sick server.
ant to stop the lag from costing you users and sales? Contact us today for expert IT consulting to audit your current server health check implementation and build a resilient, high-performing foundation for scale.
Frequently Asked Questions (FAQ)
Q: My cloud hosting service promises “high availability.” Isn’t that enough?
A: No. “High availability” only means your server is on, not that it’s performing well or fast. A server can be 100% “up” but still too slow from a high CPU load to be usable by your customers.
Q: What is the single most important metric a founder should watch?
A: Focus on CPU I/O Wait Time (%wa), as a consistently high reading signals that your processor is stuck waiting for slow disk access. This is the primary root cause of many intermittent and crippling application slowdowns.
Q: We use a major cloud provider (AWS, Google Cloud, Azure). Do we still need APM?
A: Yes, absolutely. Your cloud provider monitors the infrastructure, but APM is necessary to pinpoint bottlenecks in your specific application code, database queries, or third-party API calls.
Q: How do server health issues connect back to the “bad code” problems you discuss in your other articles?
A: An inefficient database query or memory leak in your code is the direct cause of resource spikes. Server monitoring alerts you to the sudden, severe CPU utilisation that signals a deeper code performance bottleneck.