.svg)
.svg)
A mobile application is a powerful tool for any business and its success must be quantified and evaluated like other business metrics like revenue and customer satisfaction.
The marketing and technical performance of a mobile app relies largely on analytics and metrics, and even if you want to make your app as cost-effective as possible, you must still leverage analytics. It’s essential for the success and future growth of your app since there are only a handful of ways to obtain such valuable information and feedback.
Though the process of gathering and analysing data starts shortly after deployment, you must consider it before you begin designing and developing your app. A number of the crucial decisions that you’ll make during development will actually be based on your app’s objectives, along with its performance from a business perspective.
While mobile analytics seem similar to web analytics, there are key differences. It involves various metrics that you can use to enhance the performance of your app. The problem is that for many, it’s tough to pinpoint precisely which ones they need to pay attention to.
In this post, we will take a close look at the most important key performance indicators (KPIs) for mobile apps and discover which ones you can use.
In the mobile world, all metrics can be classified into three groups:
- Performance and user experience (UX) metrics
- Engagement metrics
- Sales/Revenue metrics
All three are equally important, so let’s talk about each one in detail
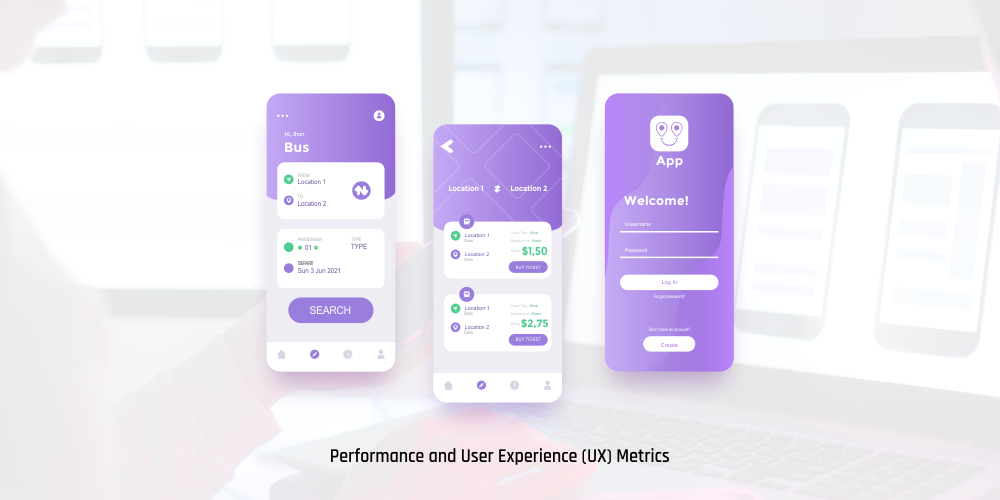
Performance and User Experience (UX) Metrics
UX metrics refer to a set of quantitative data points that are used to compare, measure, and monitor the user experience of an app over time. They are imperative for ensuring that UX design decisions are made and assessed using verifiable info instead of opinions.
These metrics will enable your development team to identify issues that compromise user experience. They will also allow your team to make tweaks and improvements from a technical standpoint.
Devices and Operating Systems (OS)
This will tell you the specific type of devices and OS used by your target audience. It will allow you to know your target audience better so you can personalise your offers. If majority of your audience are Android or iOS users, you can make the necessary preparations and modifications during the course of your app design and development.
You can also make adjustments to your quality assurance strategy. When you know the most commonly used devices, you can concentrate on them while testing your mobile app. This will allow you to build the best possible app for your intended users.
Load Time/Speed
Mobile users are generally impatient. They may wait at first, but they will likely abandon or uninstall your app if it is slow.
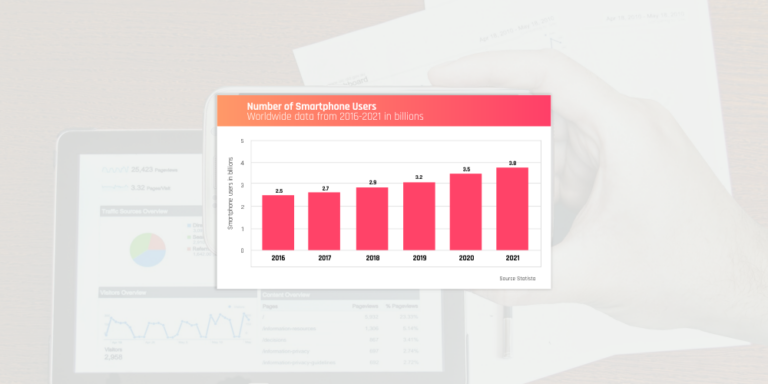
The recommended loading time for a mobile app is 2-3 seconds. But according to a 2017 study by Akamai research, the conversion rate drops by 7% for every additional second that the app consumes.
If you consider this in terms of your revenue, the lag will cost you thousands of dollars. Hence, it’s imperative to test and improve your app’s load time.
Crash Reports
One of the main reasons why mobile apps crash is the sheer variety of device operating systems, each of which likely having its own set of rules. Other possible causes include the complexity of the app, inadequate testing, poor network conditions, unexpected user actions, inappropriate memory management, and specific OS features of a device manufacturer.
A crash report will reveal at what point the app crashed, what triggered it, and where you can find it. This is crucial because people get pissed off when mobile apps crash. Based on a survey conducted by Dimensional Research, if an app crashes, 53% of users will uninstall it.
Engagement Metrics

Engagement metrics define the manner by which users interact with your mobile app and tell you whether they love it.
There are different tools that you can use to obtain direct insights into user engagement. Bear in mind that engagement rate has a direct correlation to your revenue, so you must pay close attention to it.
Number of Downloads
The very first step to achieve app success is to attain a huge number of downloads. This is generally regarded as the most important metric for quantifying user engagement because the main goal is to consolidate a broad user base.
Understanding and monitoring the source of your app installs is also crucial because from a marketing perspective, this will help you assess the effectiveness of your marketing strategies and advertising channels.
Session Length
This refers to the period between the opening and closing of your mobile app by a user. Essentially, this is the time during which a user engages or performs actions in your app. More engagement means longer session durations.
Aside from the session length and the number of daily sessions, developers can pinpoint those users who spend a lot of time on the app and figure out what features and functionalities they like. This will allow them to improve the overall experience for less-engaged users.
Retention Rate
The retention rate of your mobile app is defined by the percentage of users that return over the past 30 days. You can increase this by making some tweaks to your onboarding flow after studying the behavior of those who retain as well as those who don’t.
Retention highlights your most engaged and most valued users. It provides better targeting opportunities and UX customisation. It has been shown that on average, mobile apps only retain 40% of their initial users after 30 days. And considering the fact that the cost for installation is rising, it is better to concentrate your efforts on retention instead of acquisition.
Churn Rate
This indicates the number of users that abandon or uninstall your app after using it a few times. It’s imperative that you keep this figure as low as possible. If many users abandon your app, this can mean several things: your app lags or crashes; there’s no new content; or there are few to no updates at all.
Based on statistics, Android and iOS apps lose around 96% of users, so their monthly churn rate is approximately 8%. You must therefore target better than this for your mobile app.
Sales/Revenue Metrics

Revenue refers to the amount of money that your app generates, whether through purchases made through the app or via in-app purchases. Revenue metrics also include your investment in acquiring new users. These can be considered as marketing KPIs since they show the results of your marketing activities.
Average Revenue Per User (ARPU)
This shows the average amount generated per user through in-app purchases, paid downloads, subscriptions, ad impressions or clicks, and other forms of monetisation. When multiplied by the number of active users, this figure will give you a good estimate of the value of your app.
Lifetime Value (LTV)
The lifetime value shows the total revenue each user has brought you since they first used your mobile app. It allows you to calculate how many loyal users you have and what strategies you can use to target them in a more meaningful and personalised manner. When combined with the ARPU, it can be an excellent way to determine the value of your app or its total prospective revenue.
Conversion Rate
This is one of the most important mobile app KPIs, especially if your revenue comes from selling goods or services, or if you make money through in-app purchases. In order to boost conversion rate, make personalised offers, use push notifications, utilise split testing tools, see to it that your call-to-action (CTA) buttons are clearly visible, and make sure that the purpose of every action in your app leads to a conversion.
Time to First Purchase
This KPI refers to the amount of time it takes a user who has installed your app to make a purchase, whether it’s an in-app purchase, an ecommerce purchase, or availing an upgraded version of your app.
Cost Per Install (CPI)
This measures your customer acquisition costs for those who downloaded and installed your app when they saw your advertisement (tracking paid installs instead of organic installs). According to statistics from mobile app marketing firm Geenapp, the average cost per install for Android apps is $0.86 and $0.44 for iOS apps.
Wrapping Up
These are some of the most important mobile app KPIs you need to keep track of, whether you launched your app today or five years ago. There are many more performance metrics, but being aware and properly optimised from those discussed above will get the job done. You must know how to monitor mobile app KPIs and act intelligently on the insights you get.
If you wish to learn more about mobile app KPIs, or if you want to build your own money-making app, feel free to contact us and we’ll be more than willing to help